Where did the enquiries go?
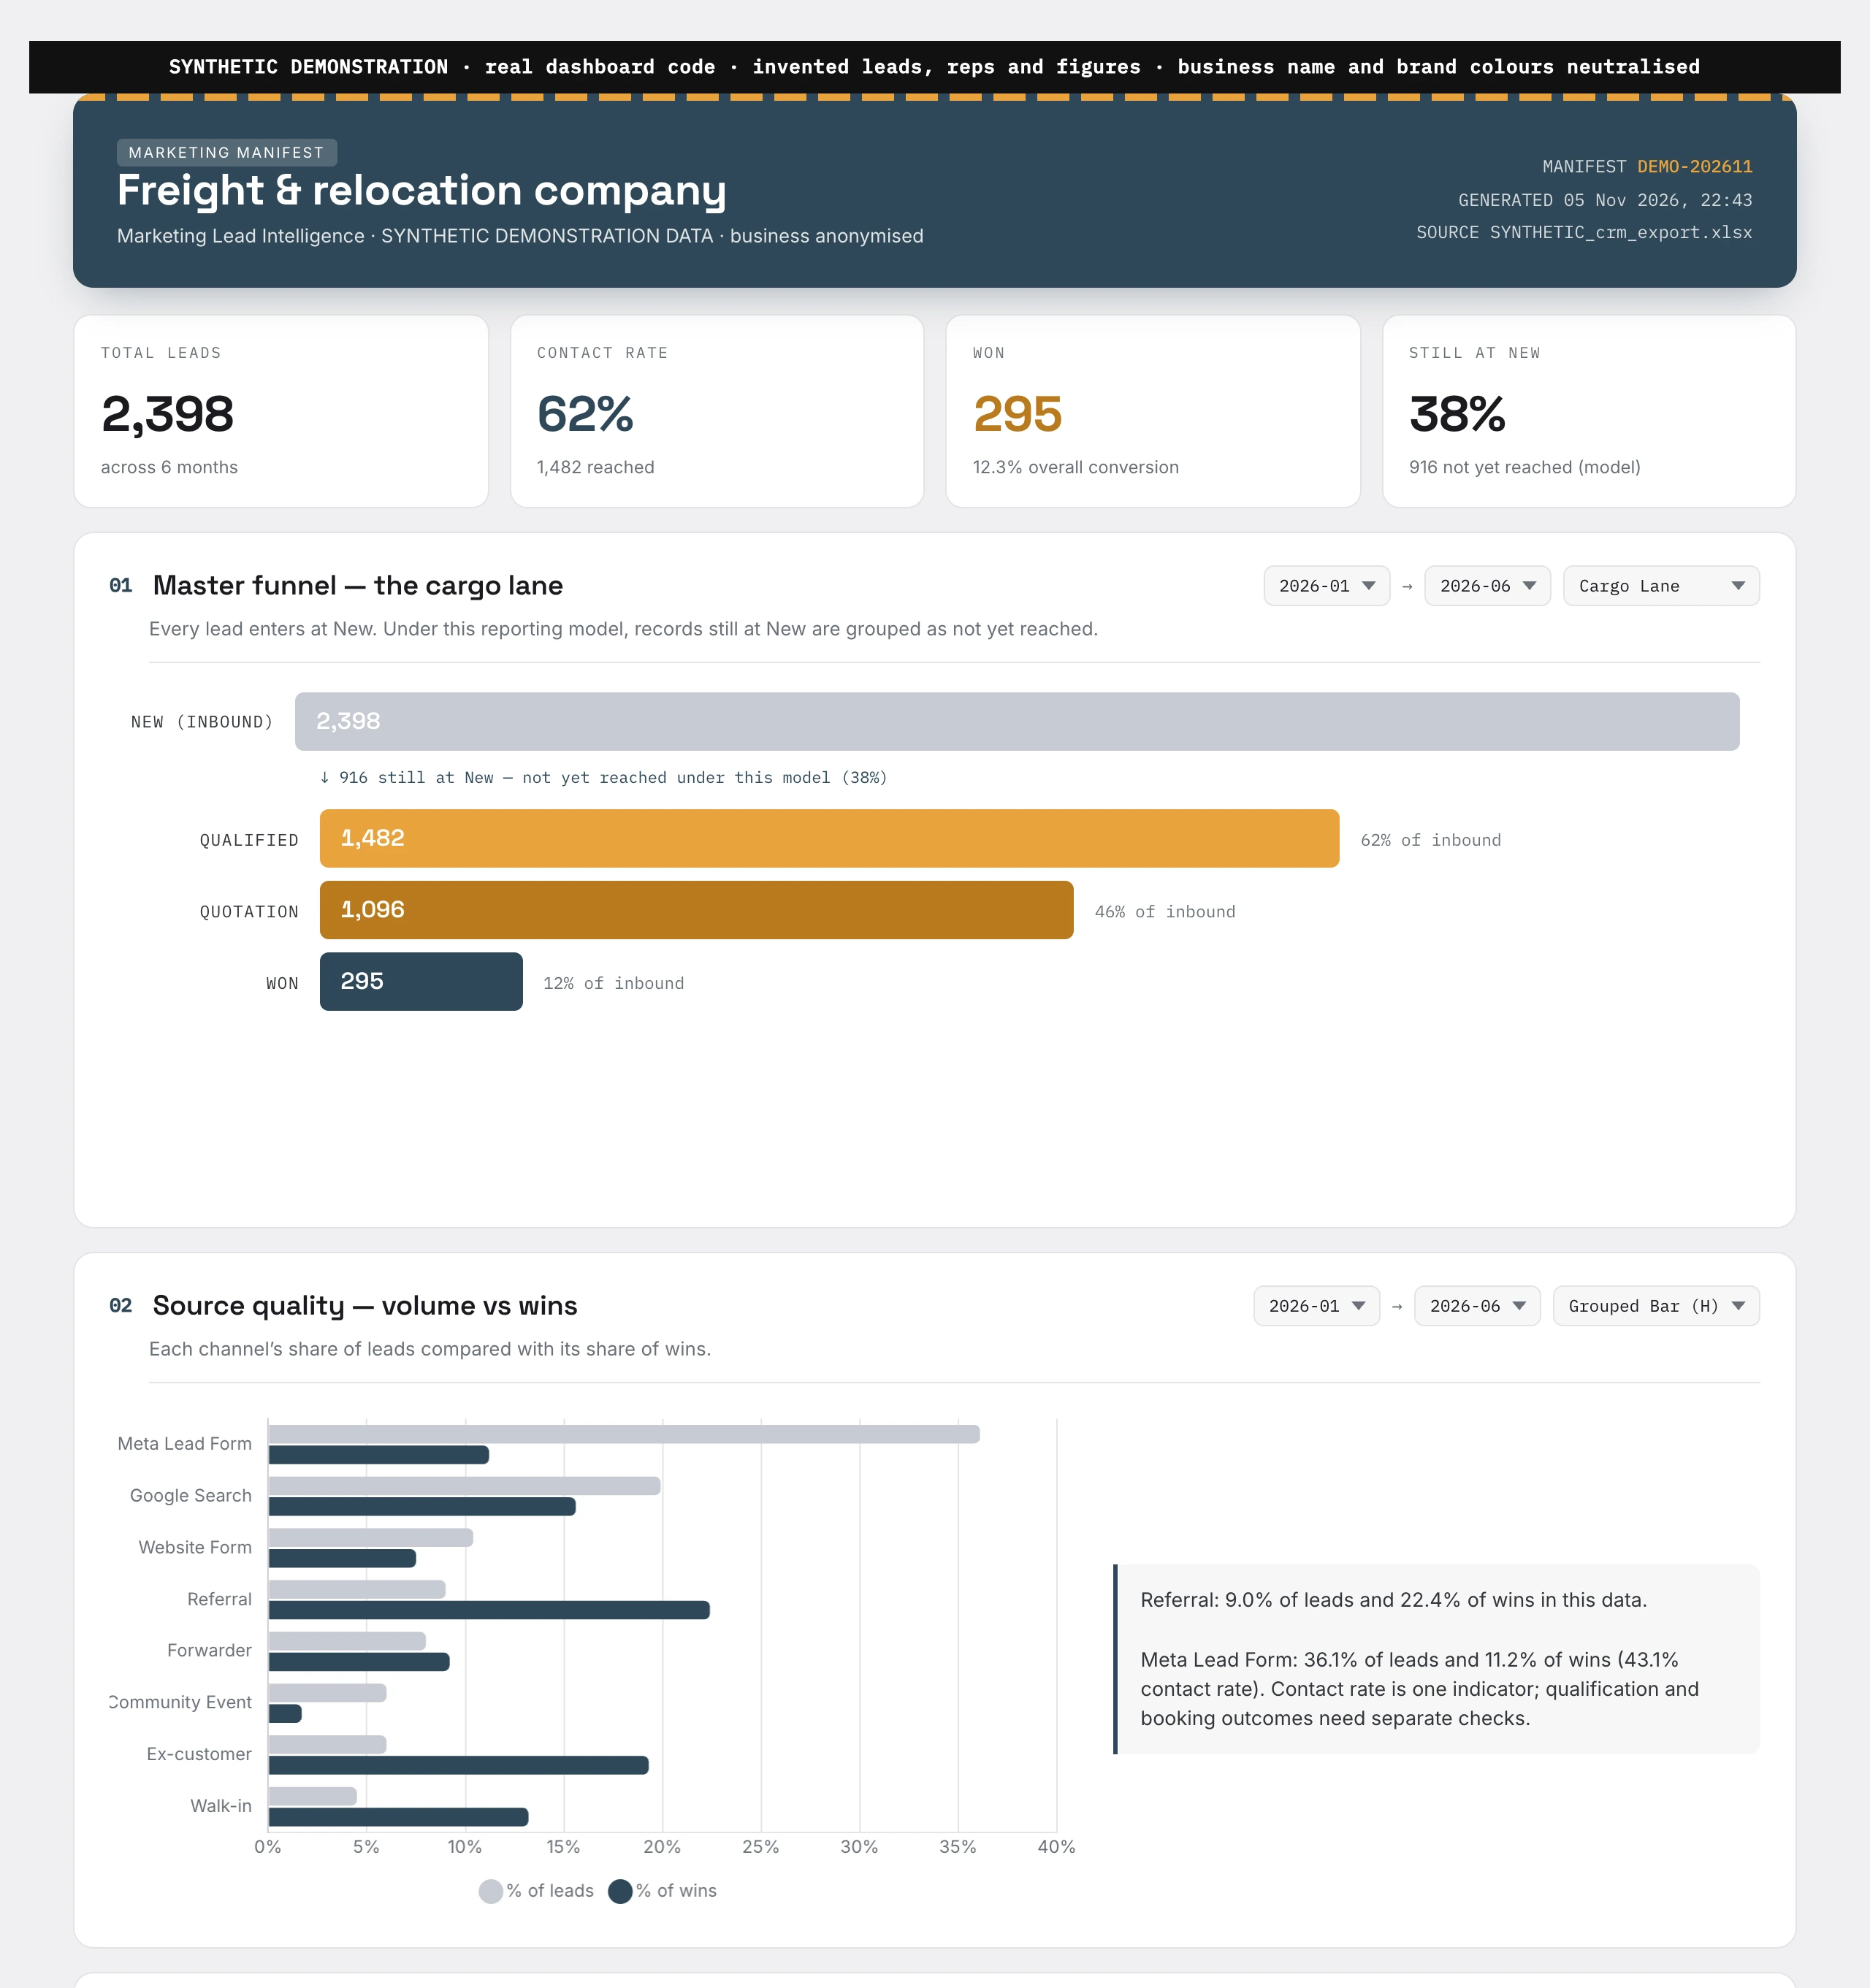
Where do enquiries come from, where do they stall, and which are won? One reporting tool answers all three. I set the rules, built it with AI assistance and kept it in use.
The rules
I counted won records as conversions, kept missing information separate and hid rates from small samples. The reporting model groups records still at New as not yet reached. Checking whether anyone attempted contact takes a separate review.
How I used it
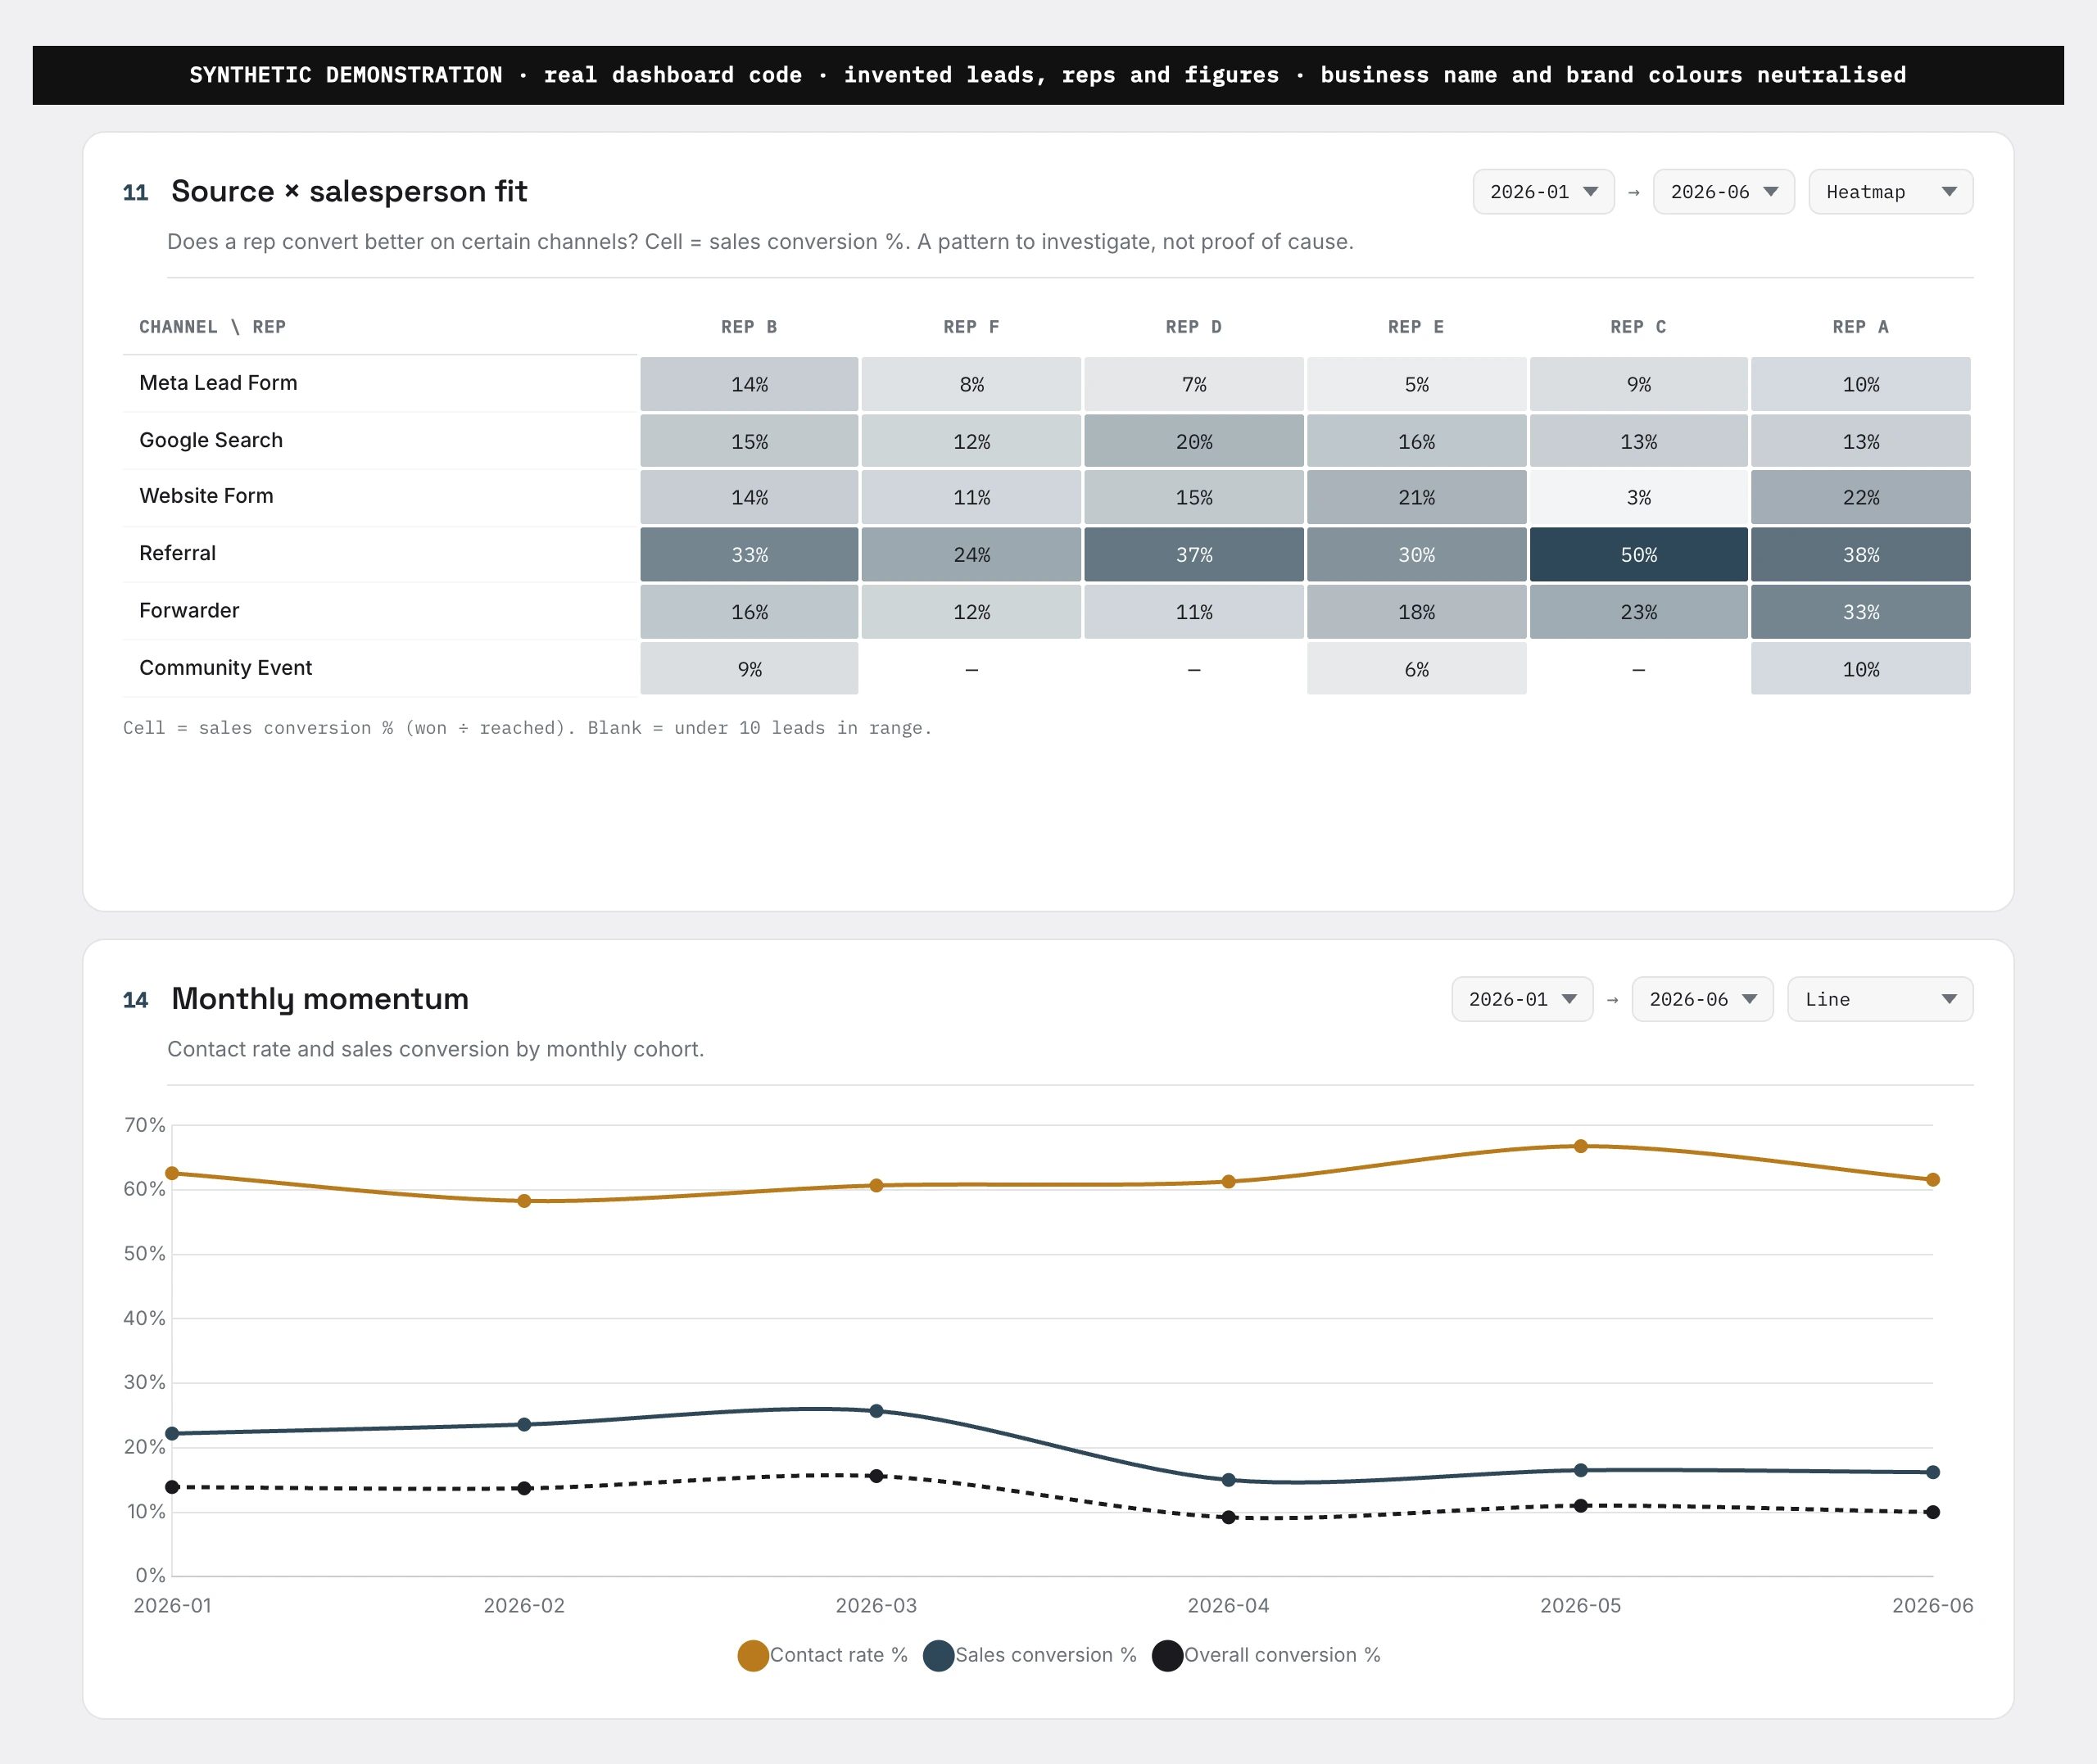
I specified fourteen reports covering the funnel, sources, contactability, stage progression and monthly trends. I ran the tool on CRM exports and continued using and updating it after the initial build. Exporting records and deciding what to do with the findings were manual steps.
Next, systems