Twelve pieces worth sharing, chosen from a longer list. Each one says what I did and what changed, and shows the evidence for it. Three parts, then how I work with AI and automation.
12 projects
Part one. The click
Fewer campaigns. More from each.
Five campaigns across Meta and Google. I set the budget, chose the channels and ran the accounts myself.
What the campaigns brought in.
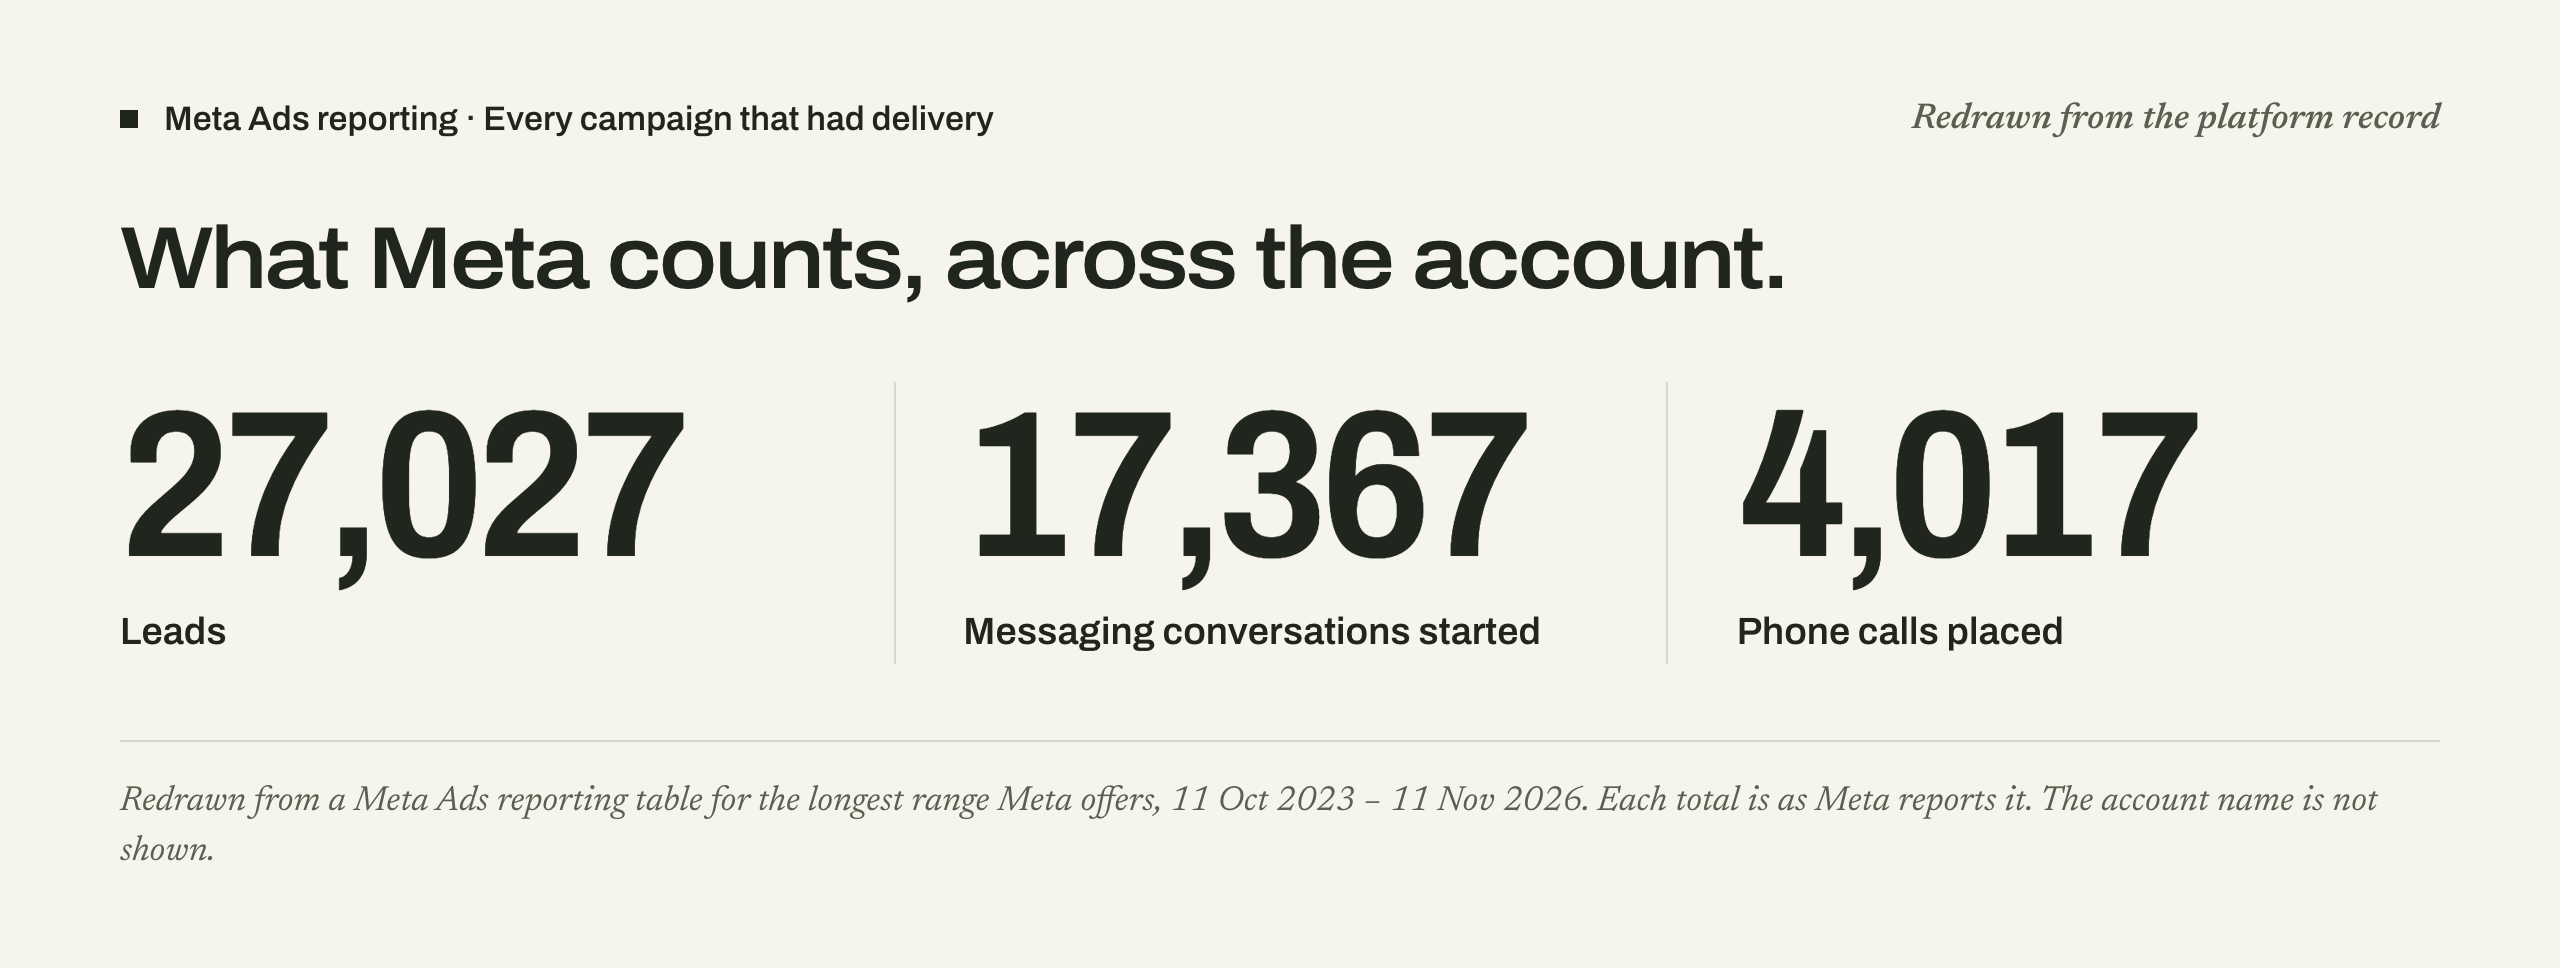
leads
27,000+
conversations started
17,000+
calls
4,000+
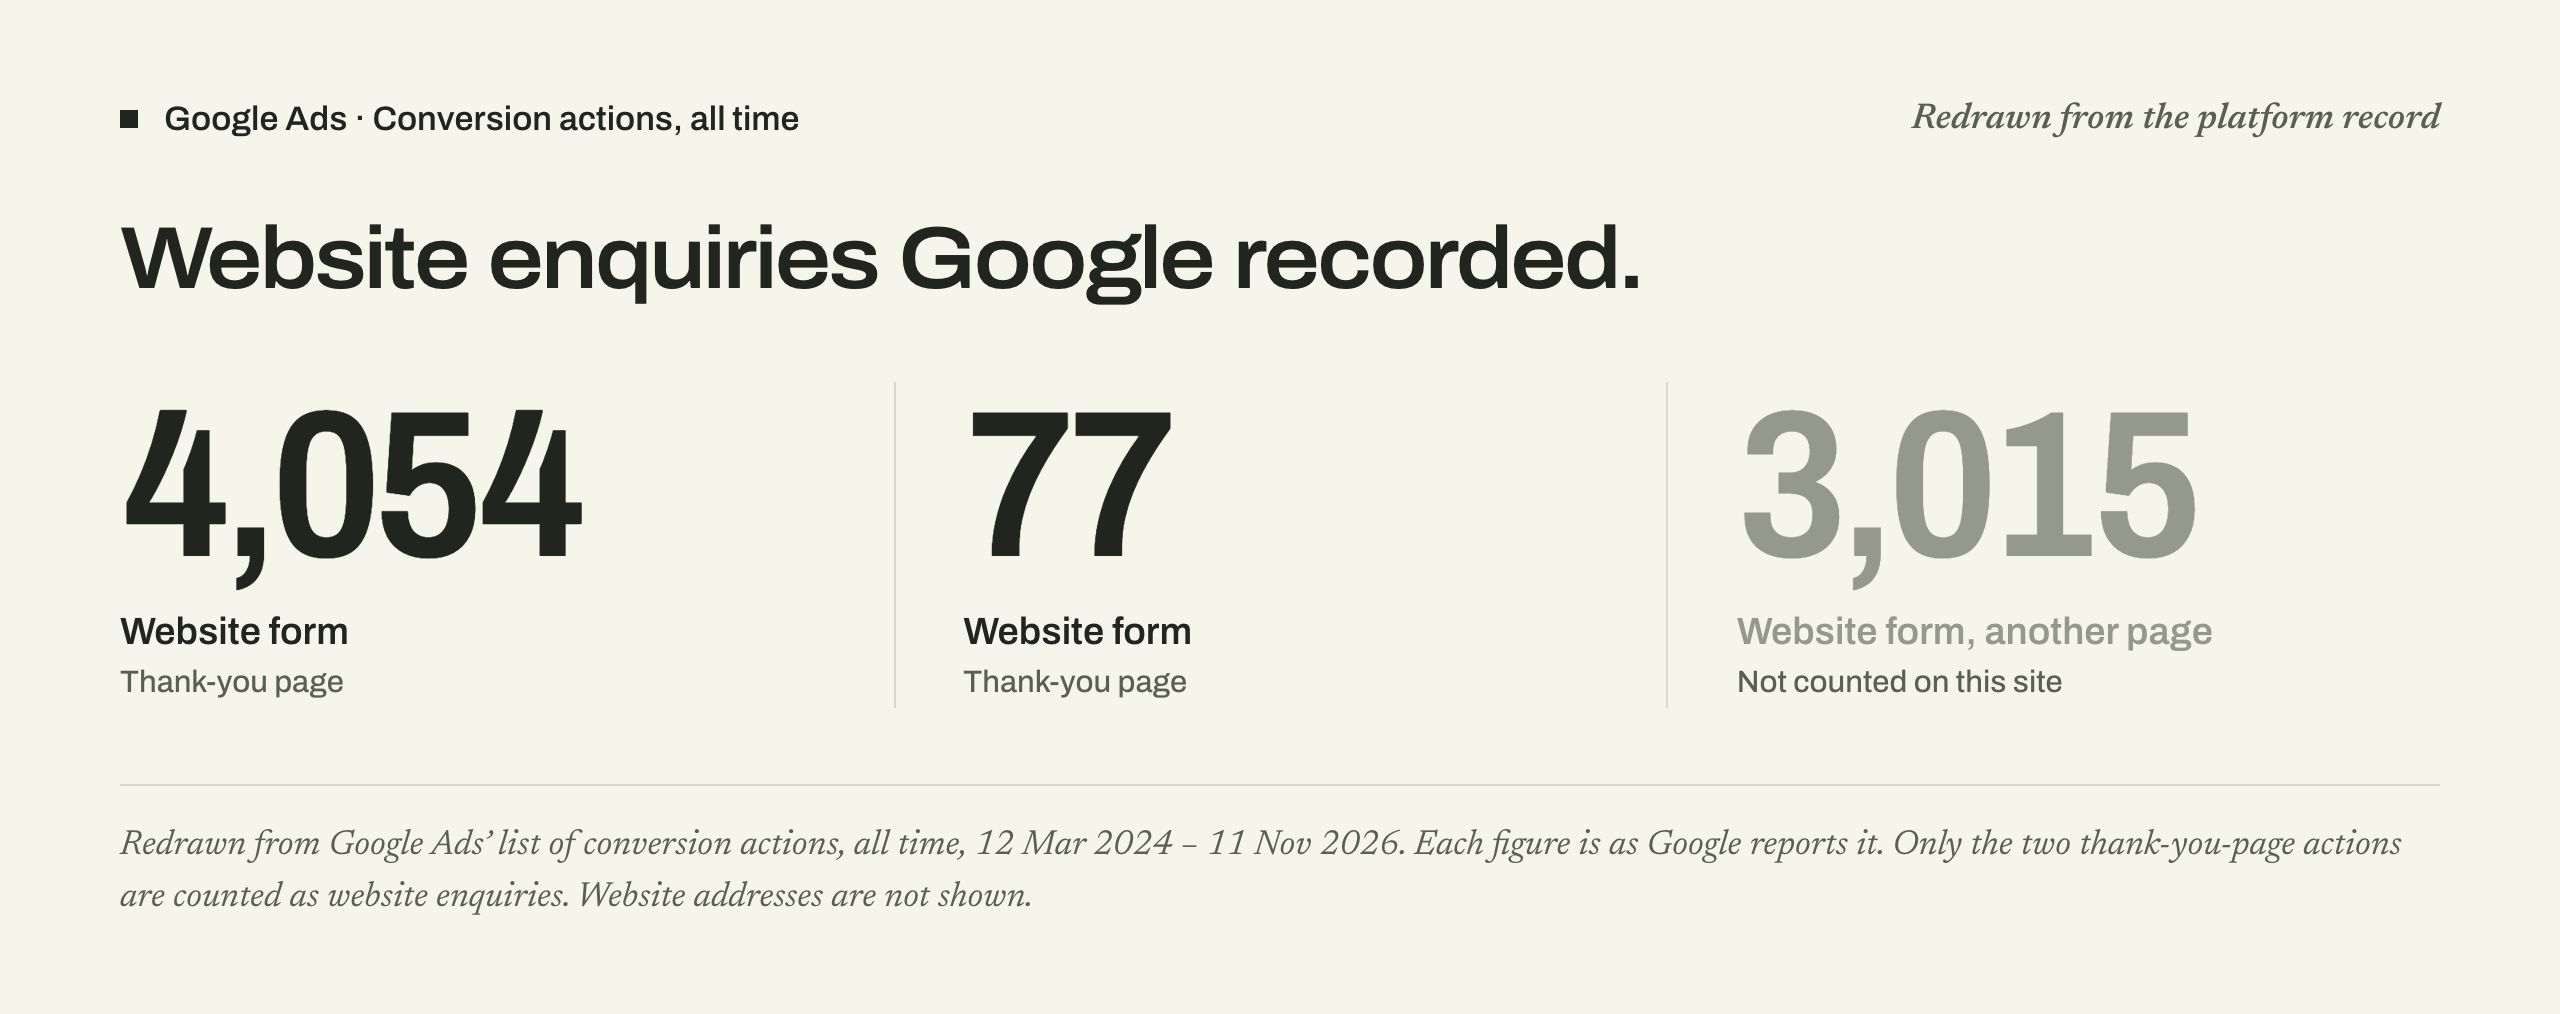
website enquiries
4,000+
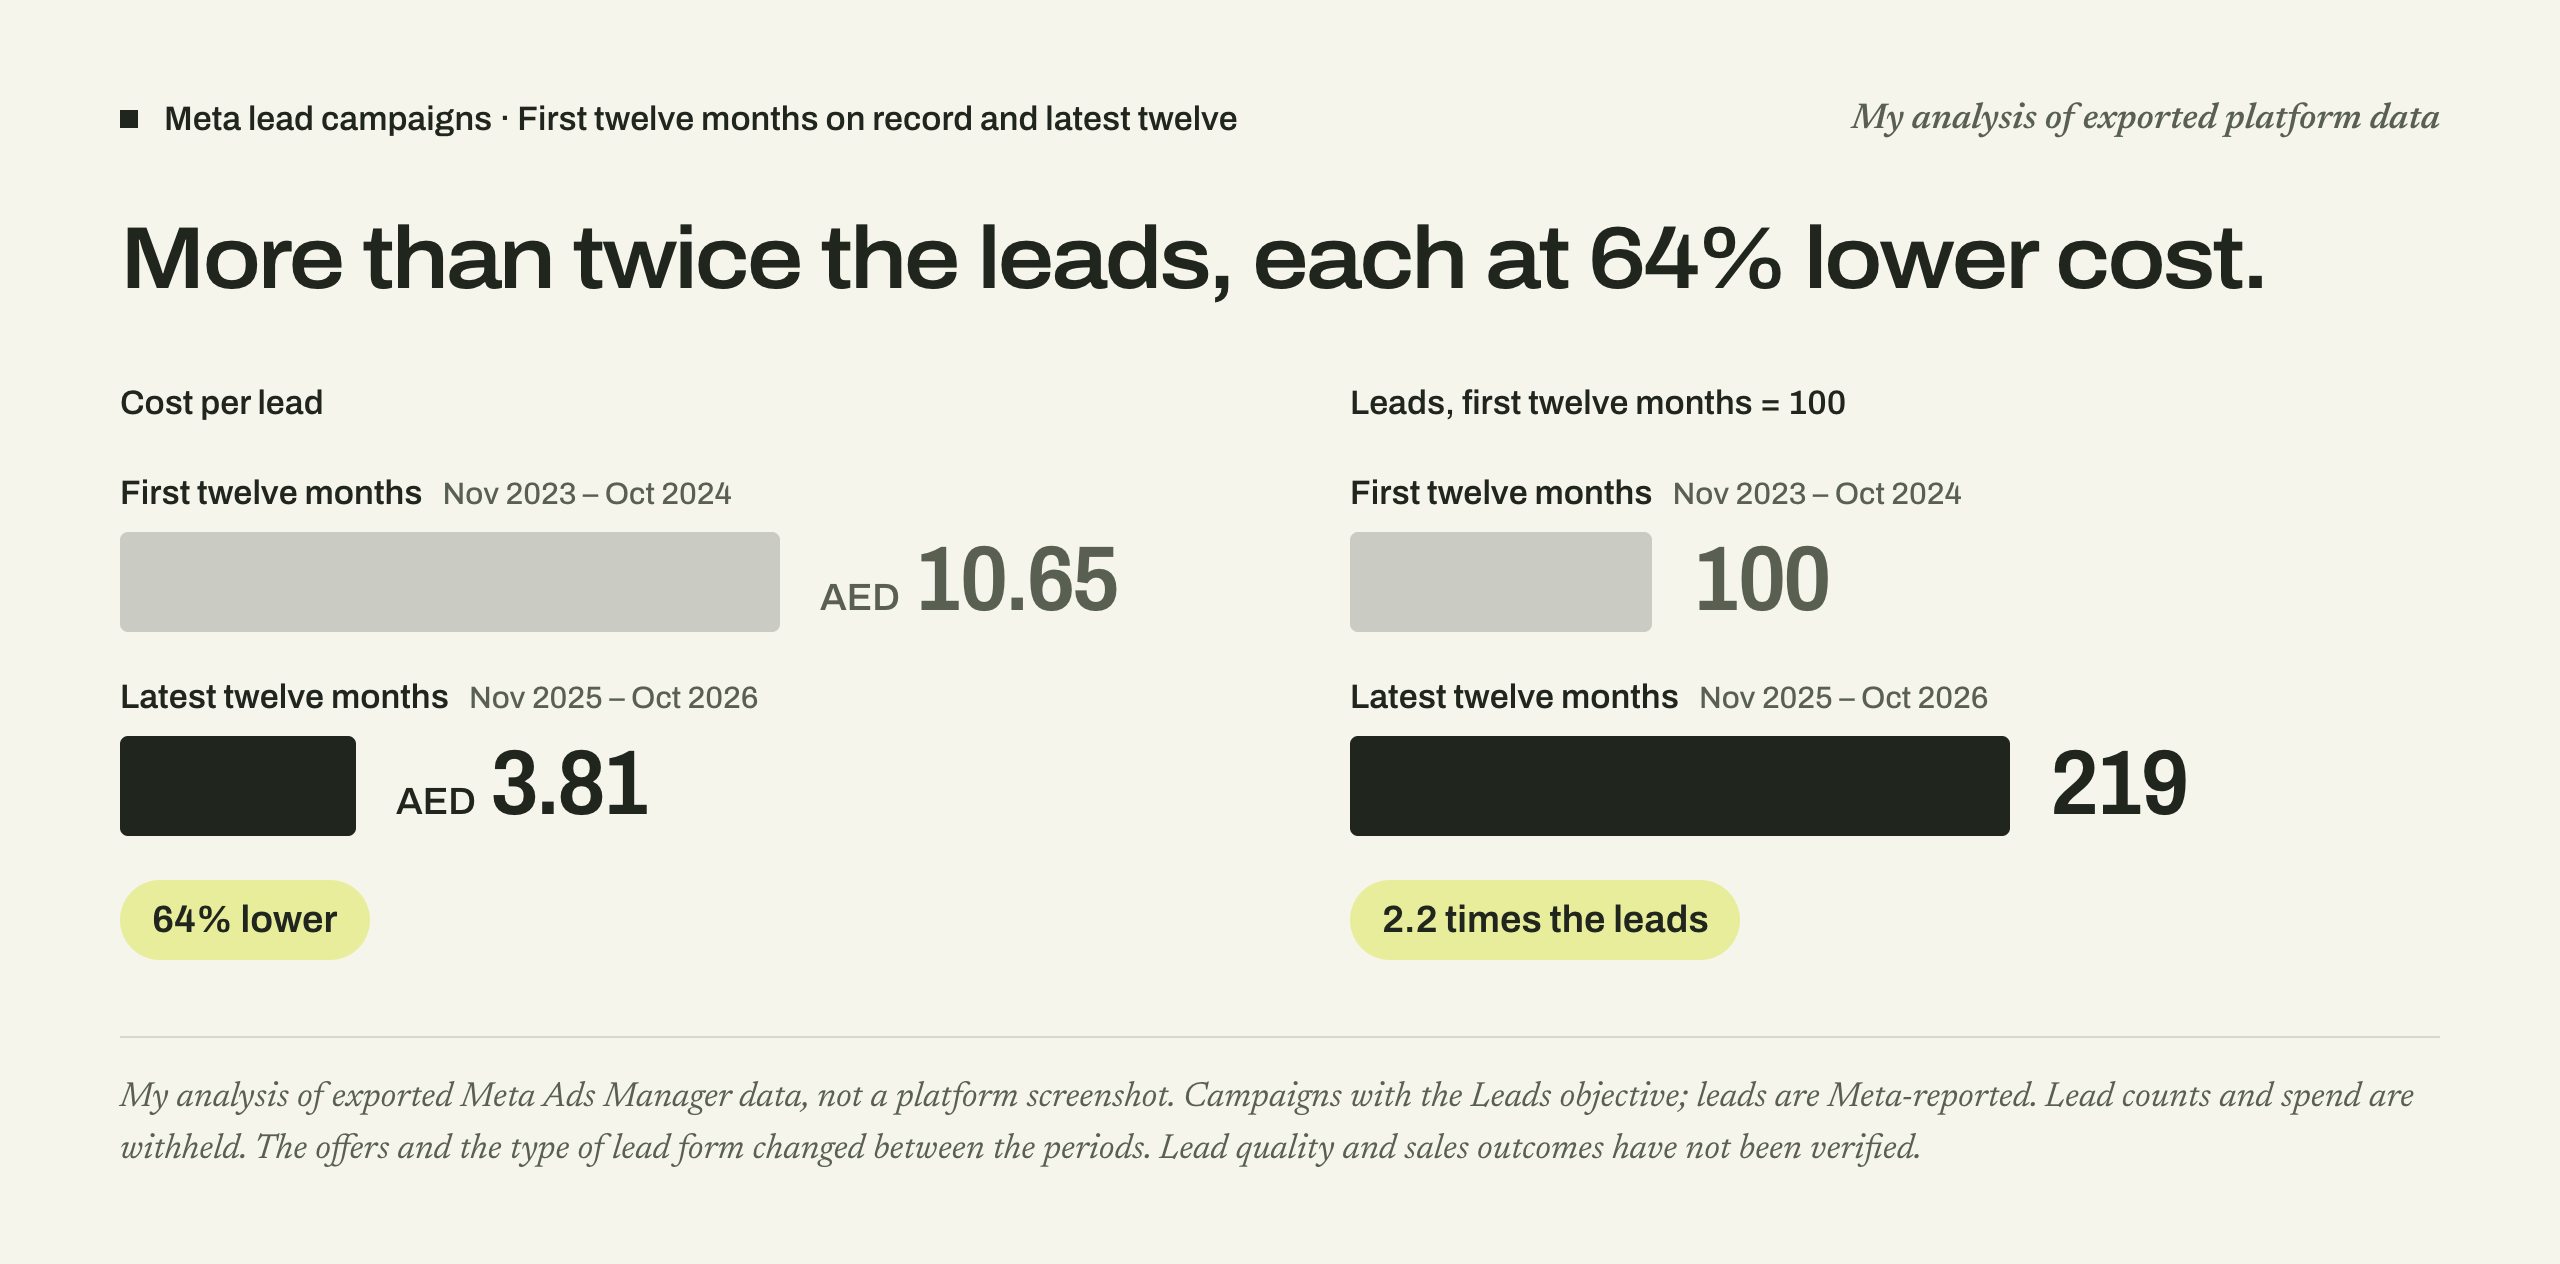
More than twice the leads, each at 64% lower cost, on a smaller budget, with 15 campaigns in place of 52.
Platform records · Rounded down
Redrawn from Meta Ads reporting: every campaign that had delivery, the longest range Meta offers (11 Oct 2023 – 11 Nov 2026). See the platform screenshotRedrawn from Google Ads: all conversion actions, all time (12 Mar 2024 – 11 Nov 2026). The two thank-you-page actions are the website enquiries counted: 4,054 and 77. See the platform screenshot
01Meta lead campaigns
Twice the leads. Less than half the cost.
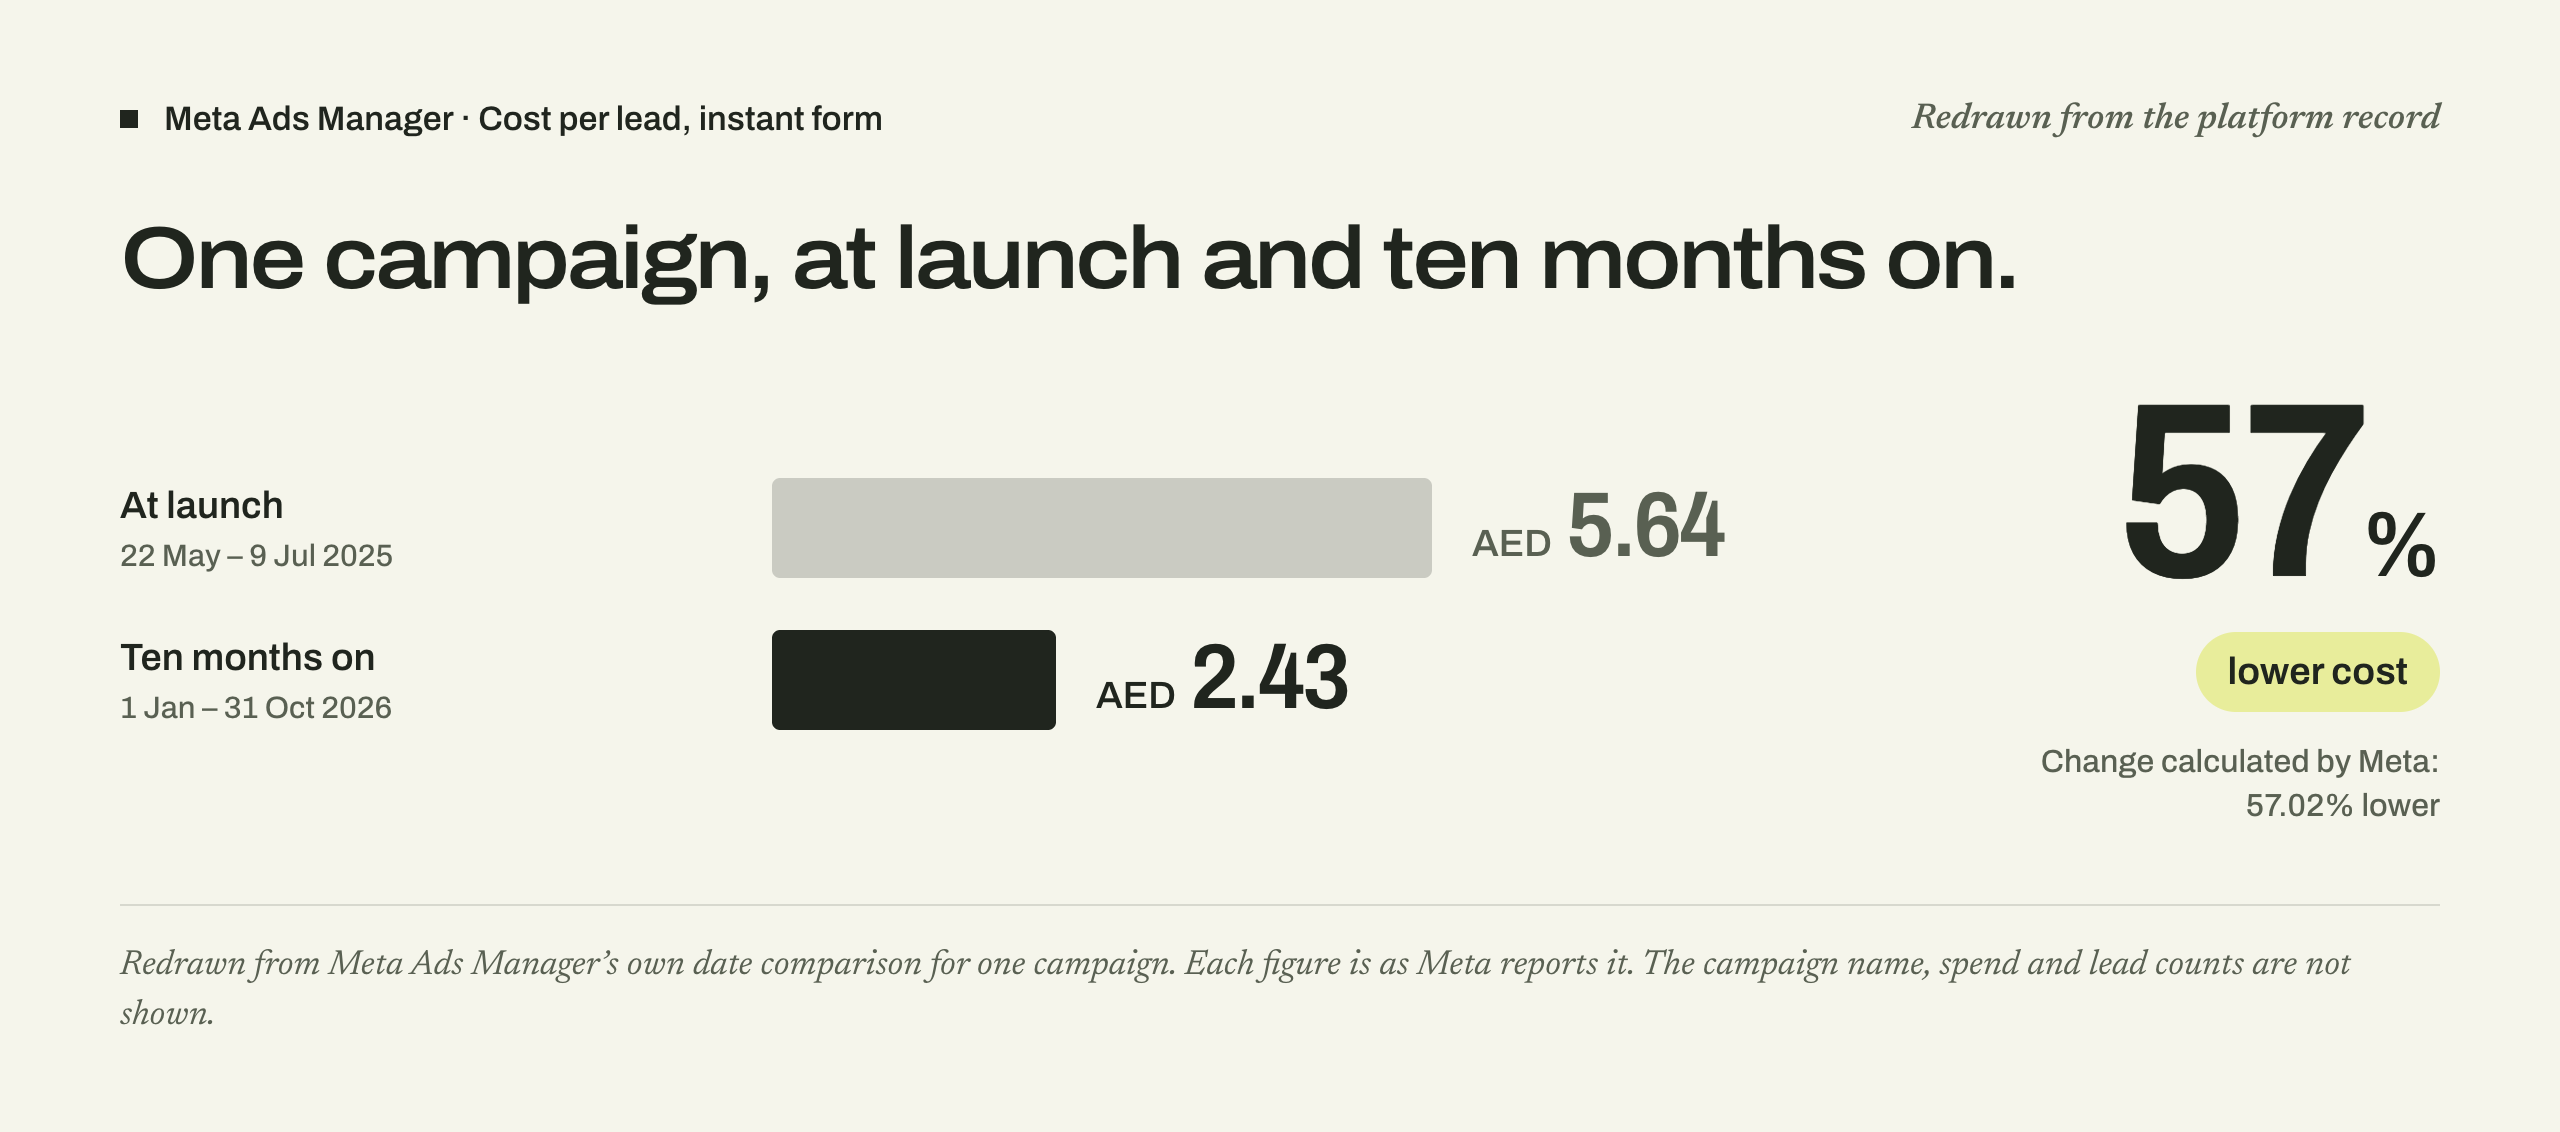
More than 27,000 leads. Across the Meta lead campaigns, leads more than doubled and the cost of each fell 64%, on a smaller budget.
Campaign planning, launch, management and optimisation
Redrawn from Meta Ads Manager’s date comparison for one campaign: cost per instant-form lead, 1 Jan – 31 Oct 2026 against 22 May – 9 Jul 2025. Change calculated by Meta. See the platform screenshotMy analysis of exported Meta data: all campaigns with the Leads objective, first twelve complete months on record and latest twelve. Lead counts and spend withheld. Not a platform screenshot.
02Meta WhatsApp campaign
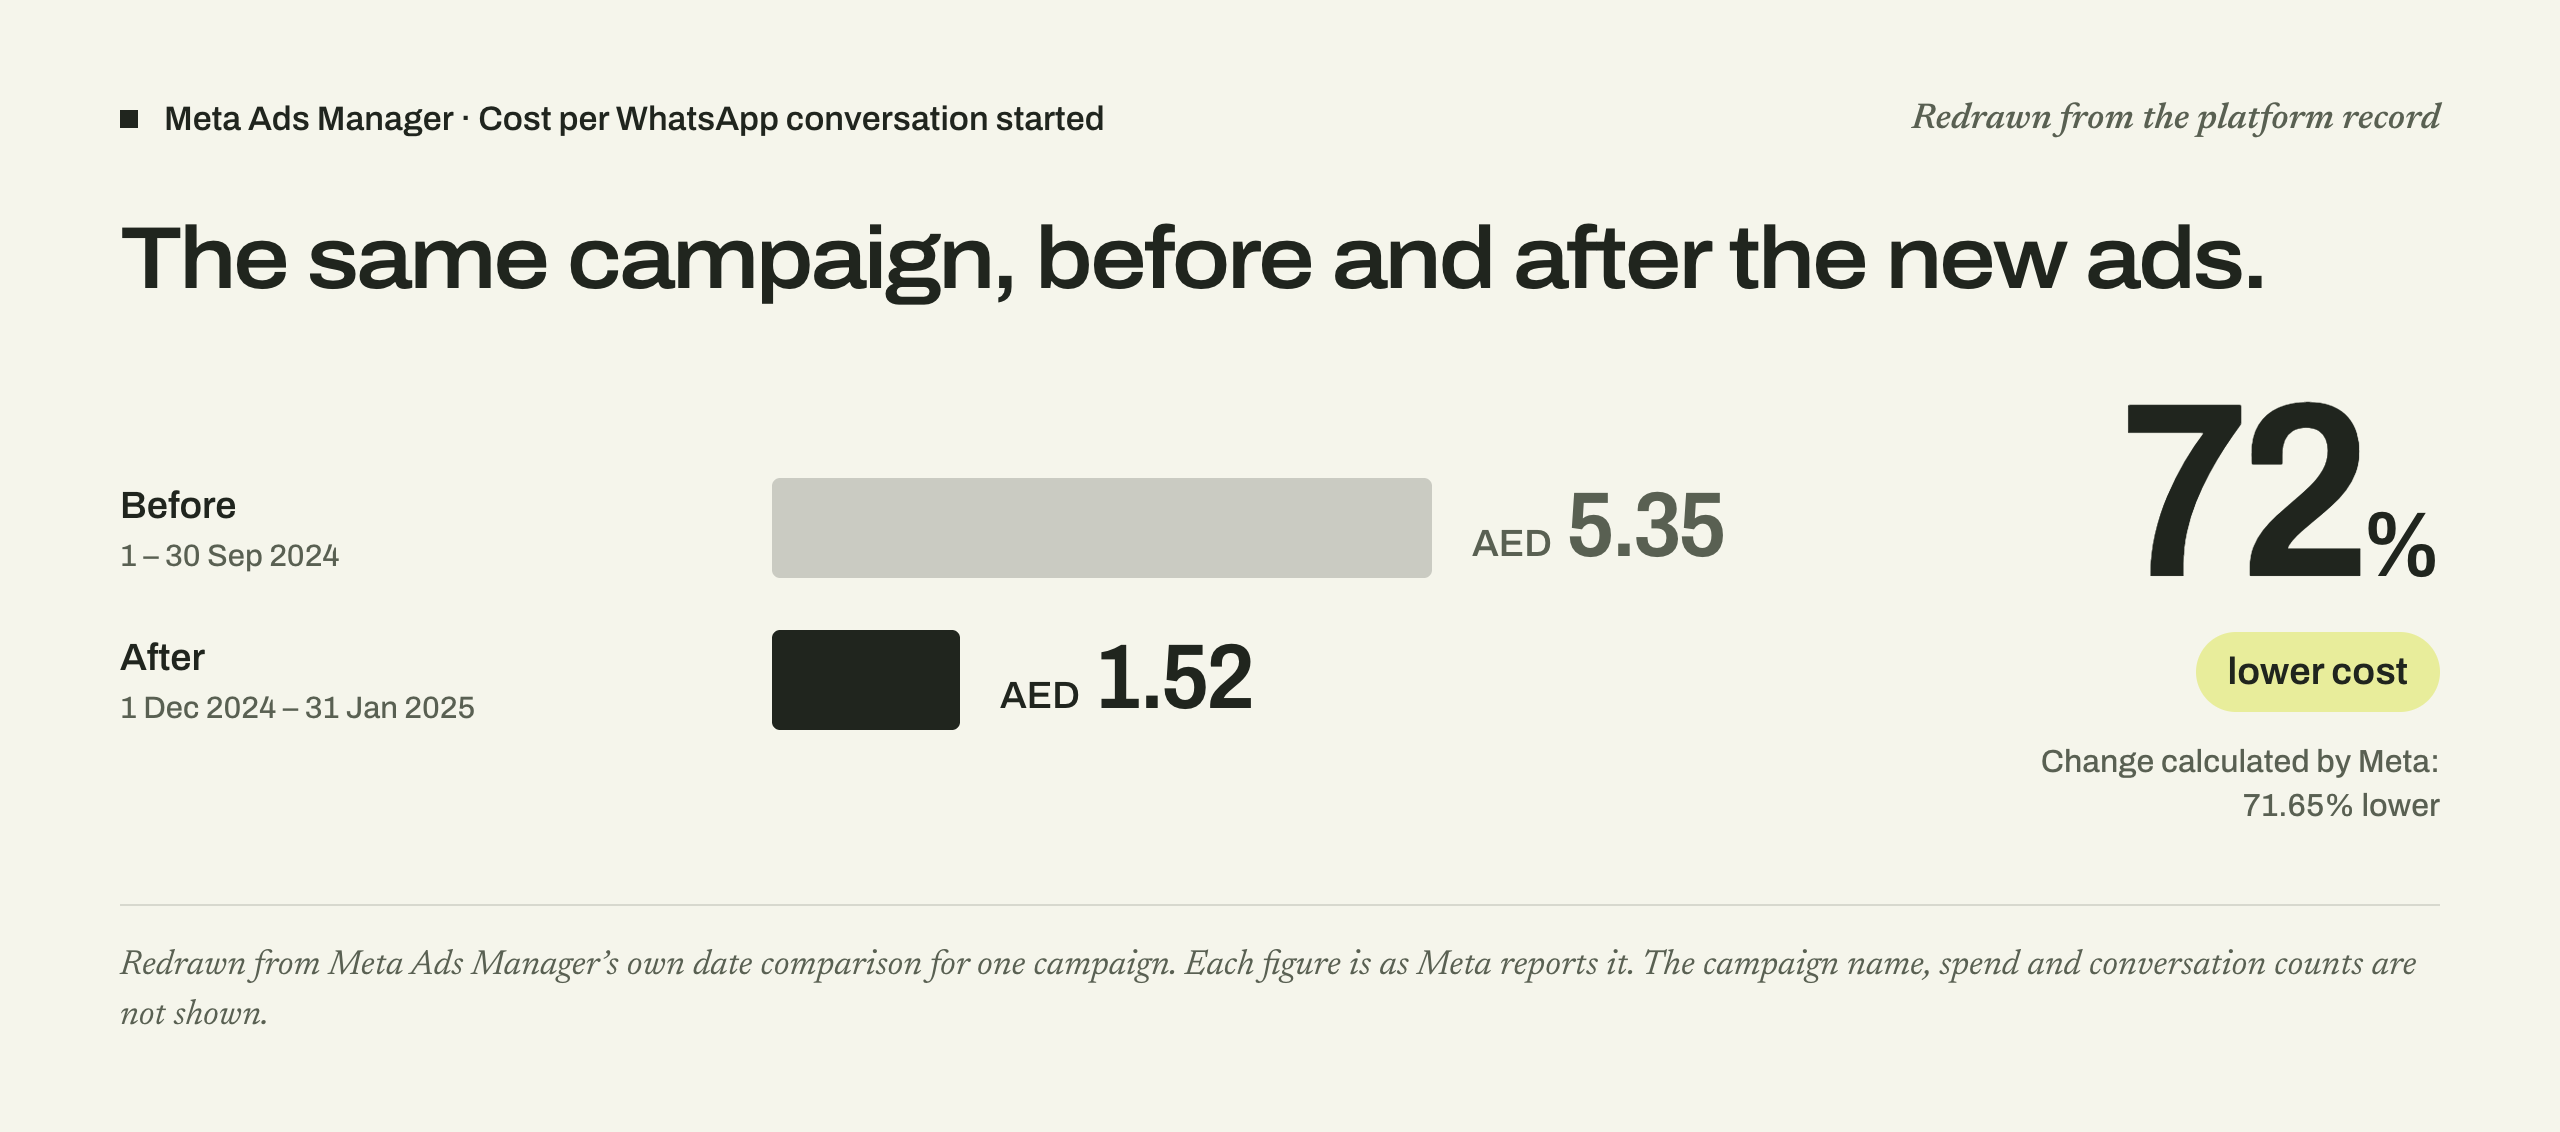
72% lower cost per conversation.
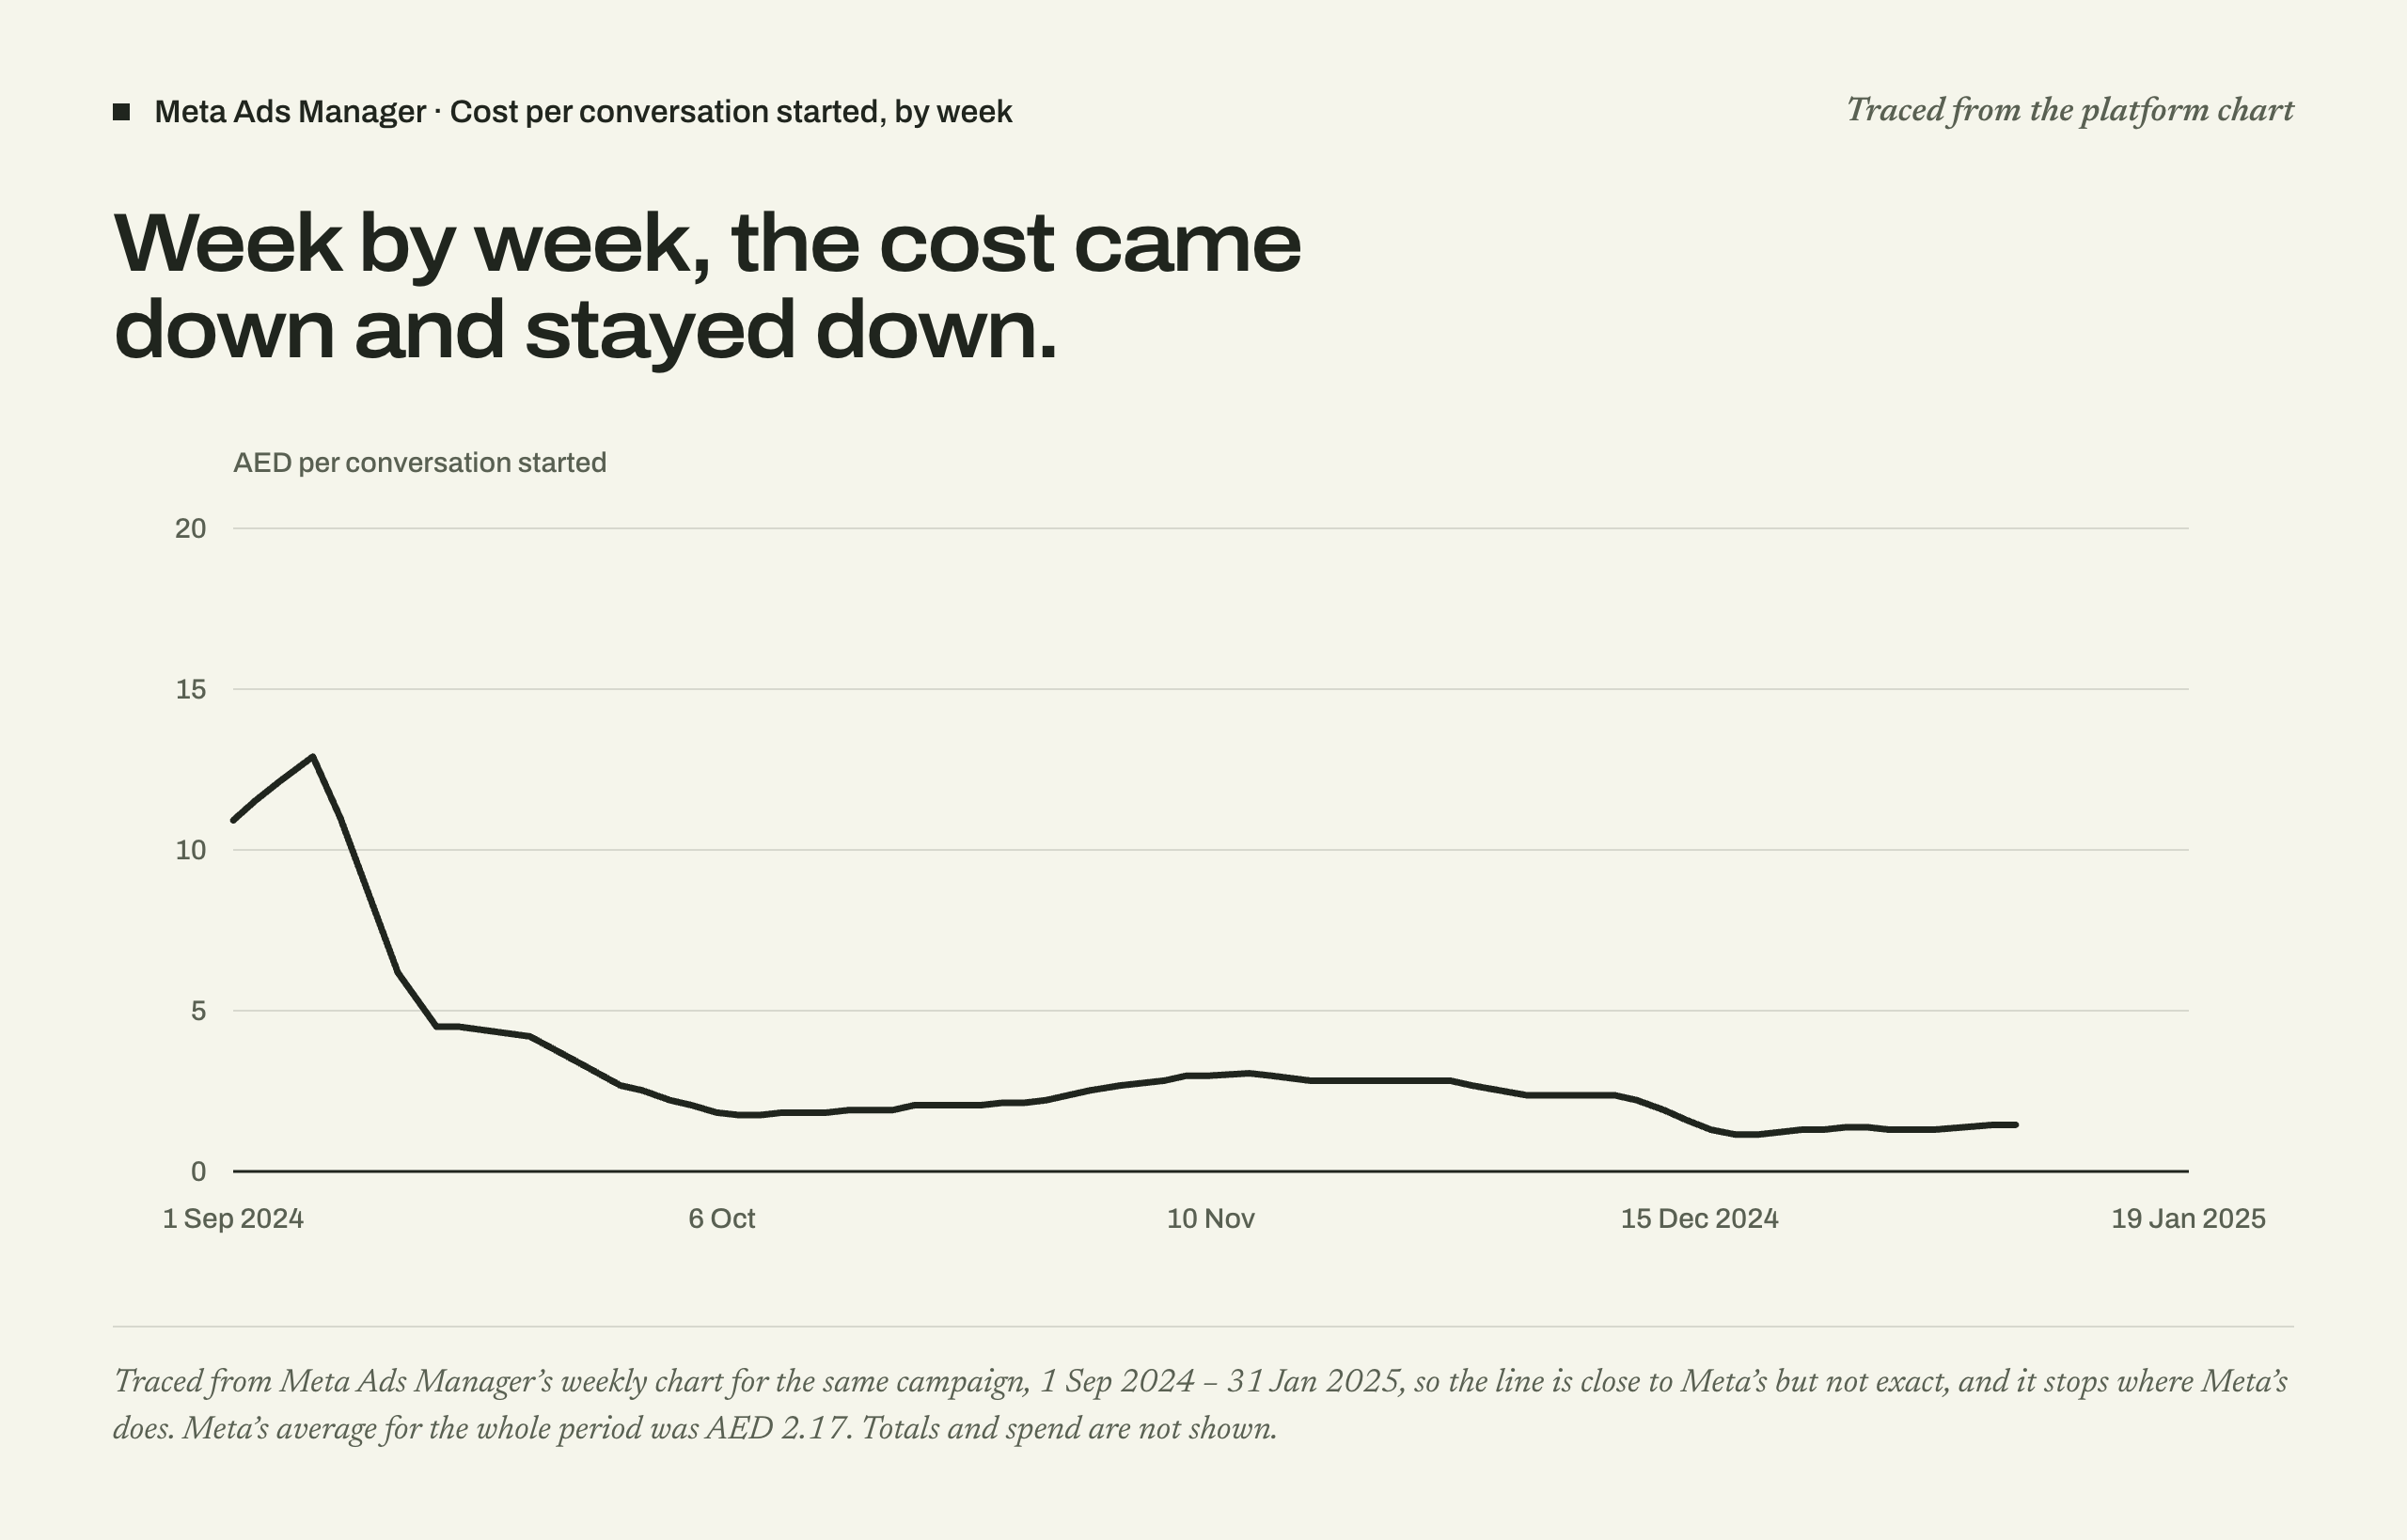
The cost of starting a WhatsApp conversation fell from AED 5.35 to AED 1.52. Across the account, messaging conversations grew 3.7 times.
Redrawn from Meta Ads Manager’s date comparison: cost per WhatsApp conversation started, 1 Dec 2024 – 31 Jan 2025 against 1–30 Sep 2024. Change calculated by Meta. See the platform screenshotTraced from Meta Ads Manager’s weekly chart of cost per conversation started, same campaign, 1 Sep 2024 – 31 Jan 2025. Close to Meta’s line, not exact. See the platform screenshot
03Meta call campaigns
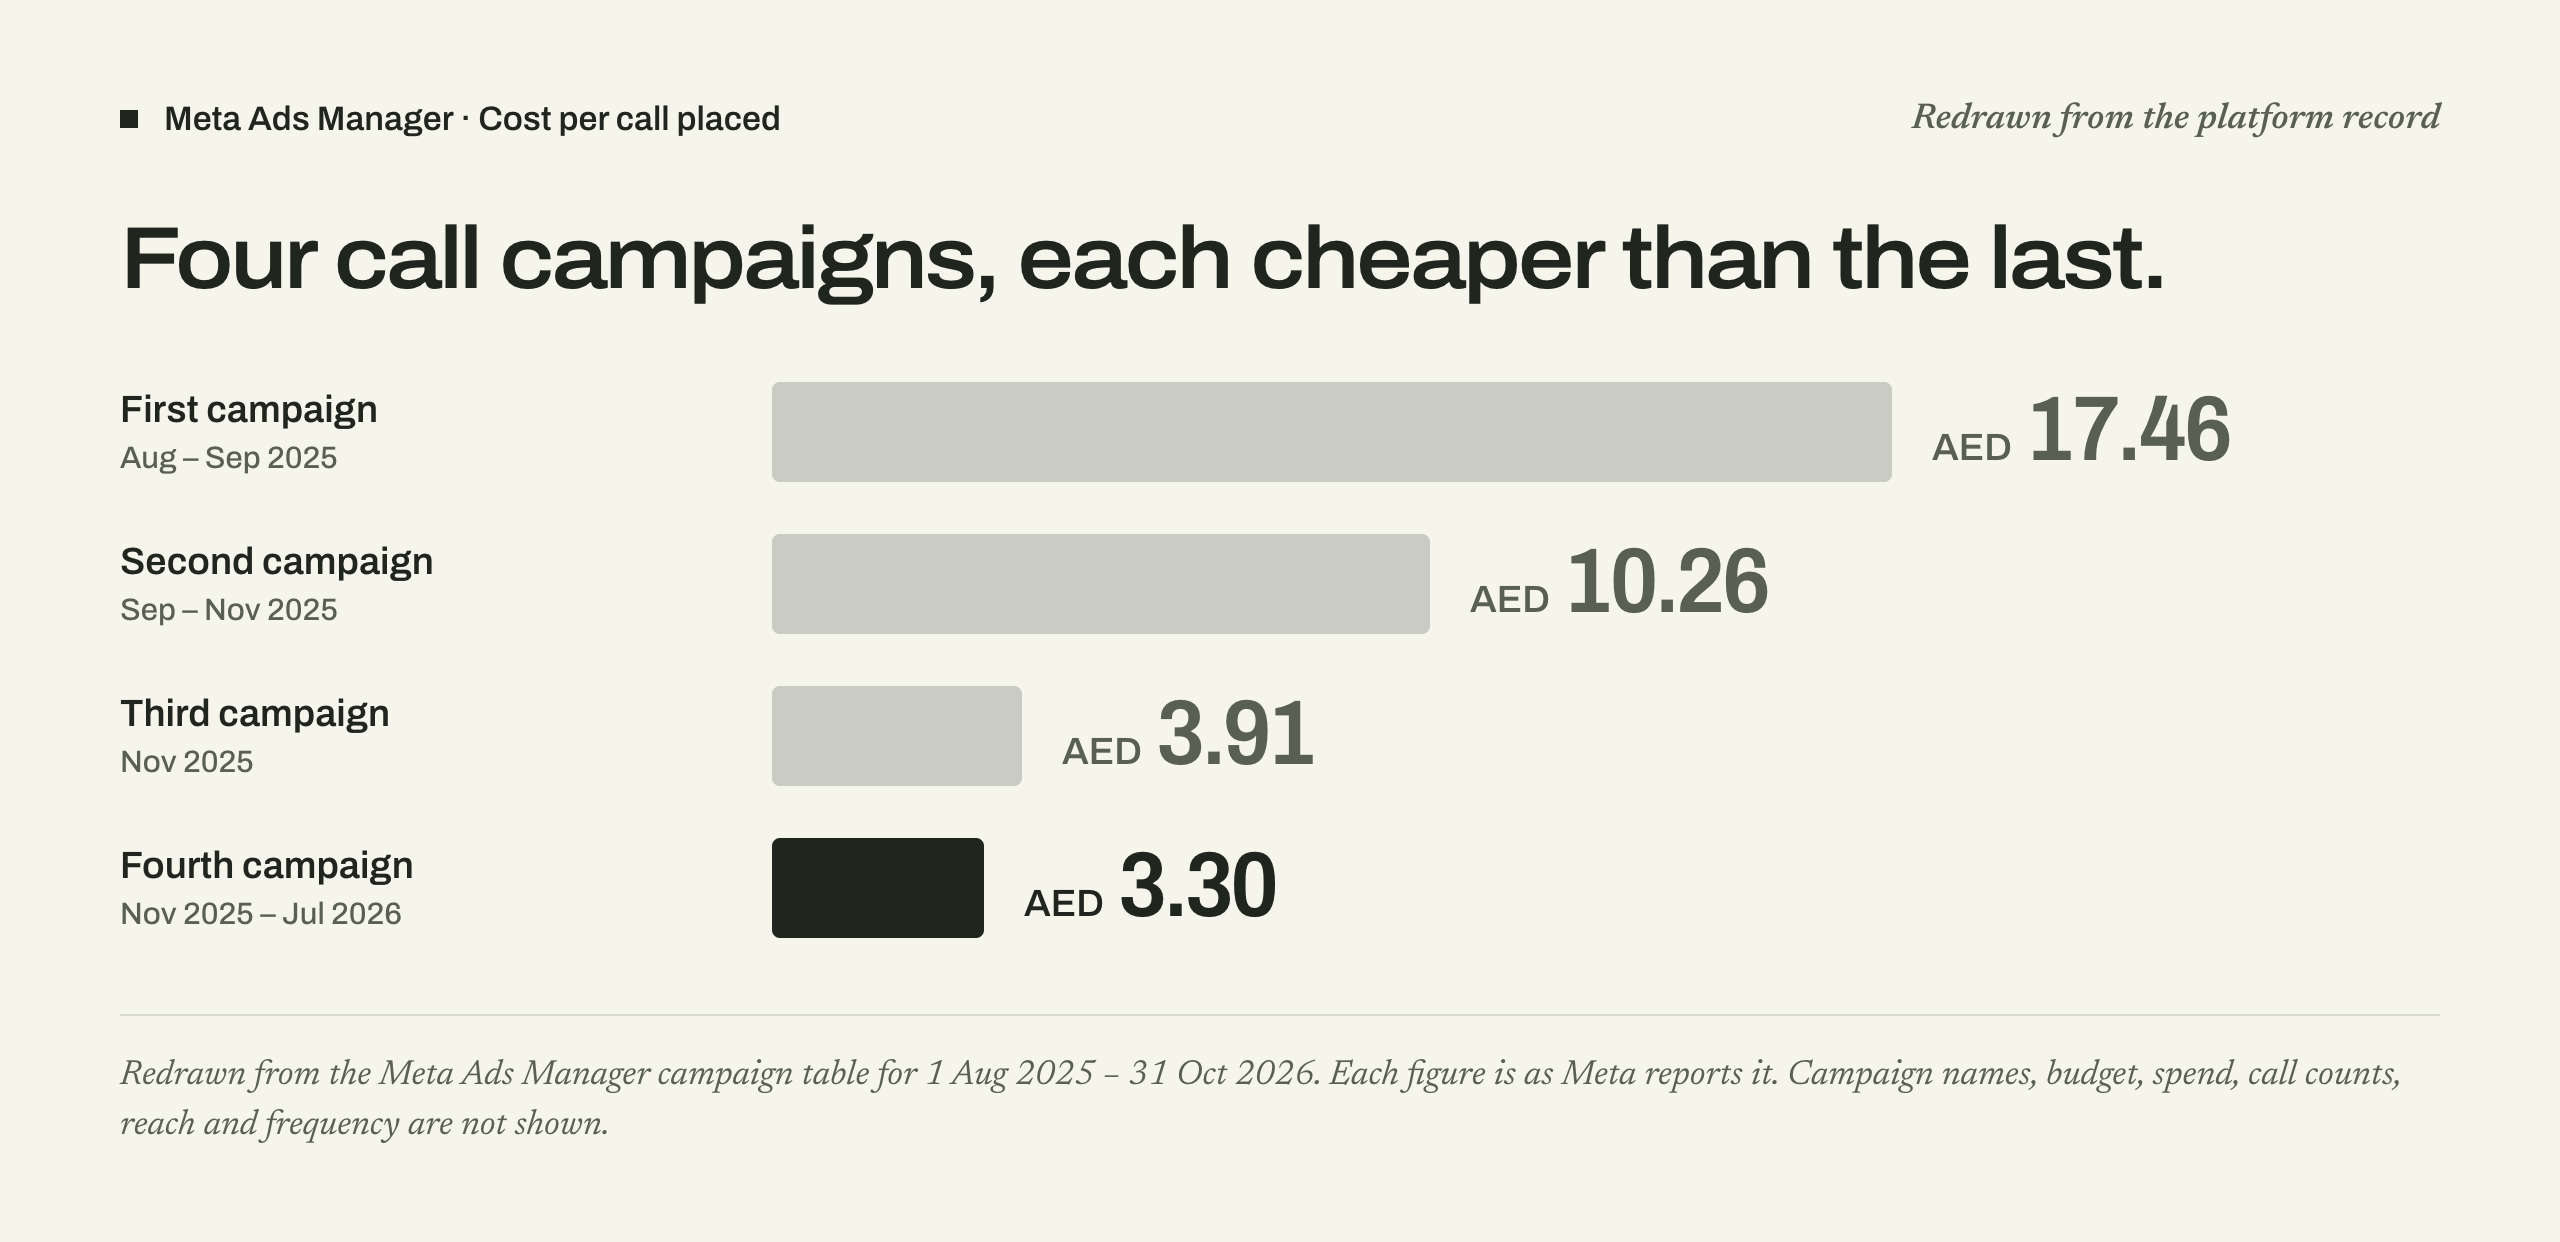
From AED 17.46 a call to AED 3.30.
Four call campaigns, one after another. Each cost less per call than the one before: AED 17.46, then 10.26, then 3.91, then 3.30.
Redrawn from the Meta Ads Manager campaign table: cost per call placed, four successive call campaigns, 1 Aug 2025 – 31 Oct 2026. See the platform screenshot
04Google Search campaigns
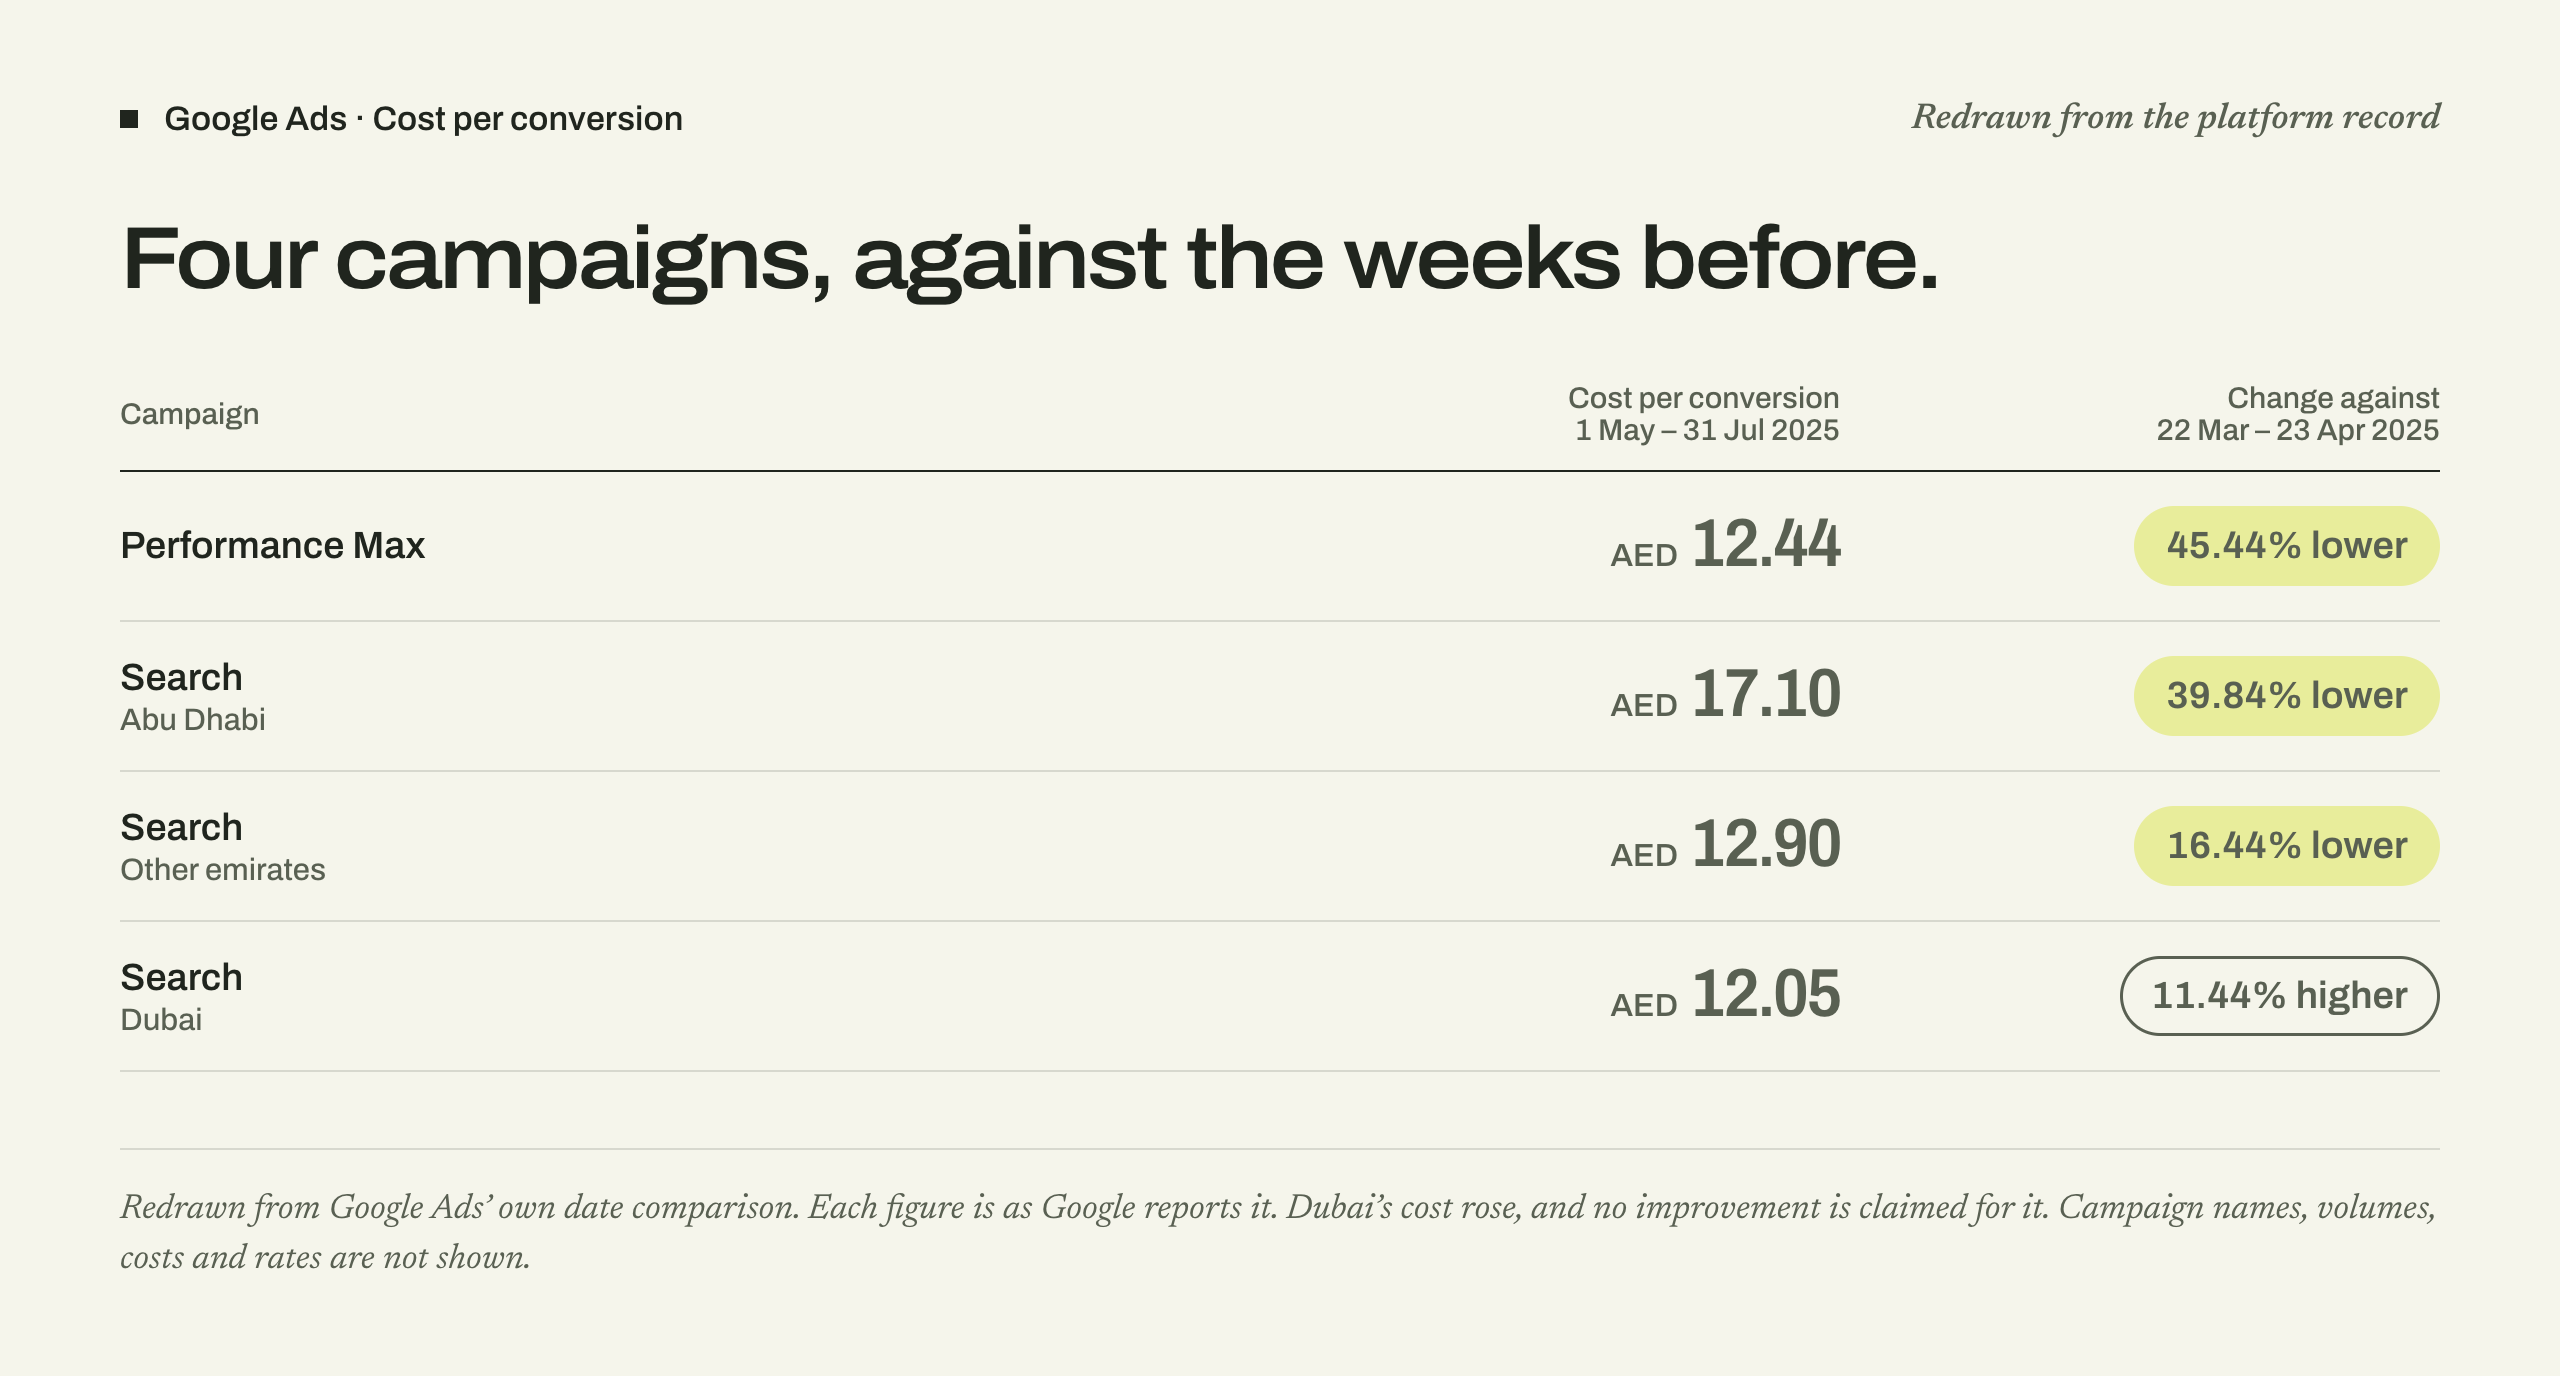
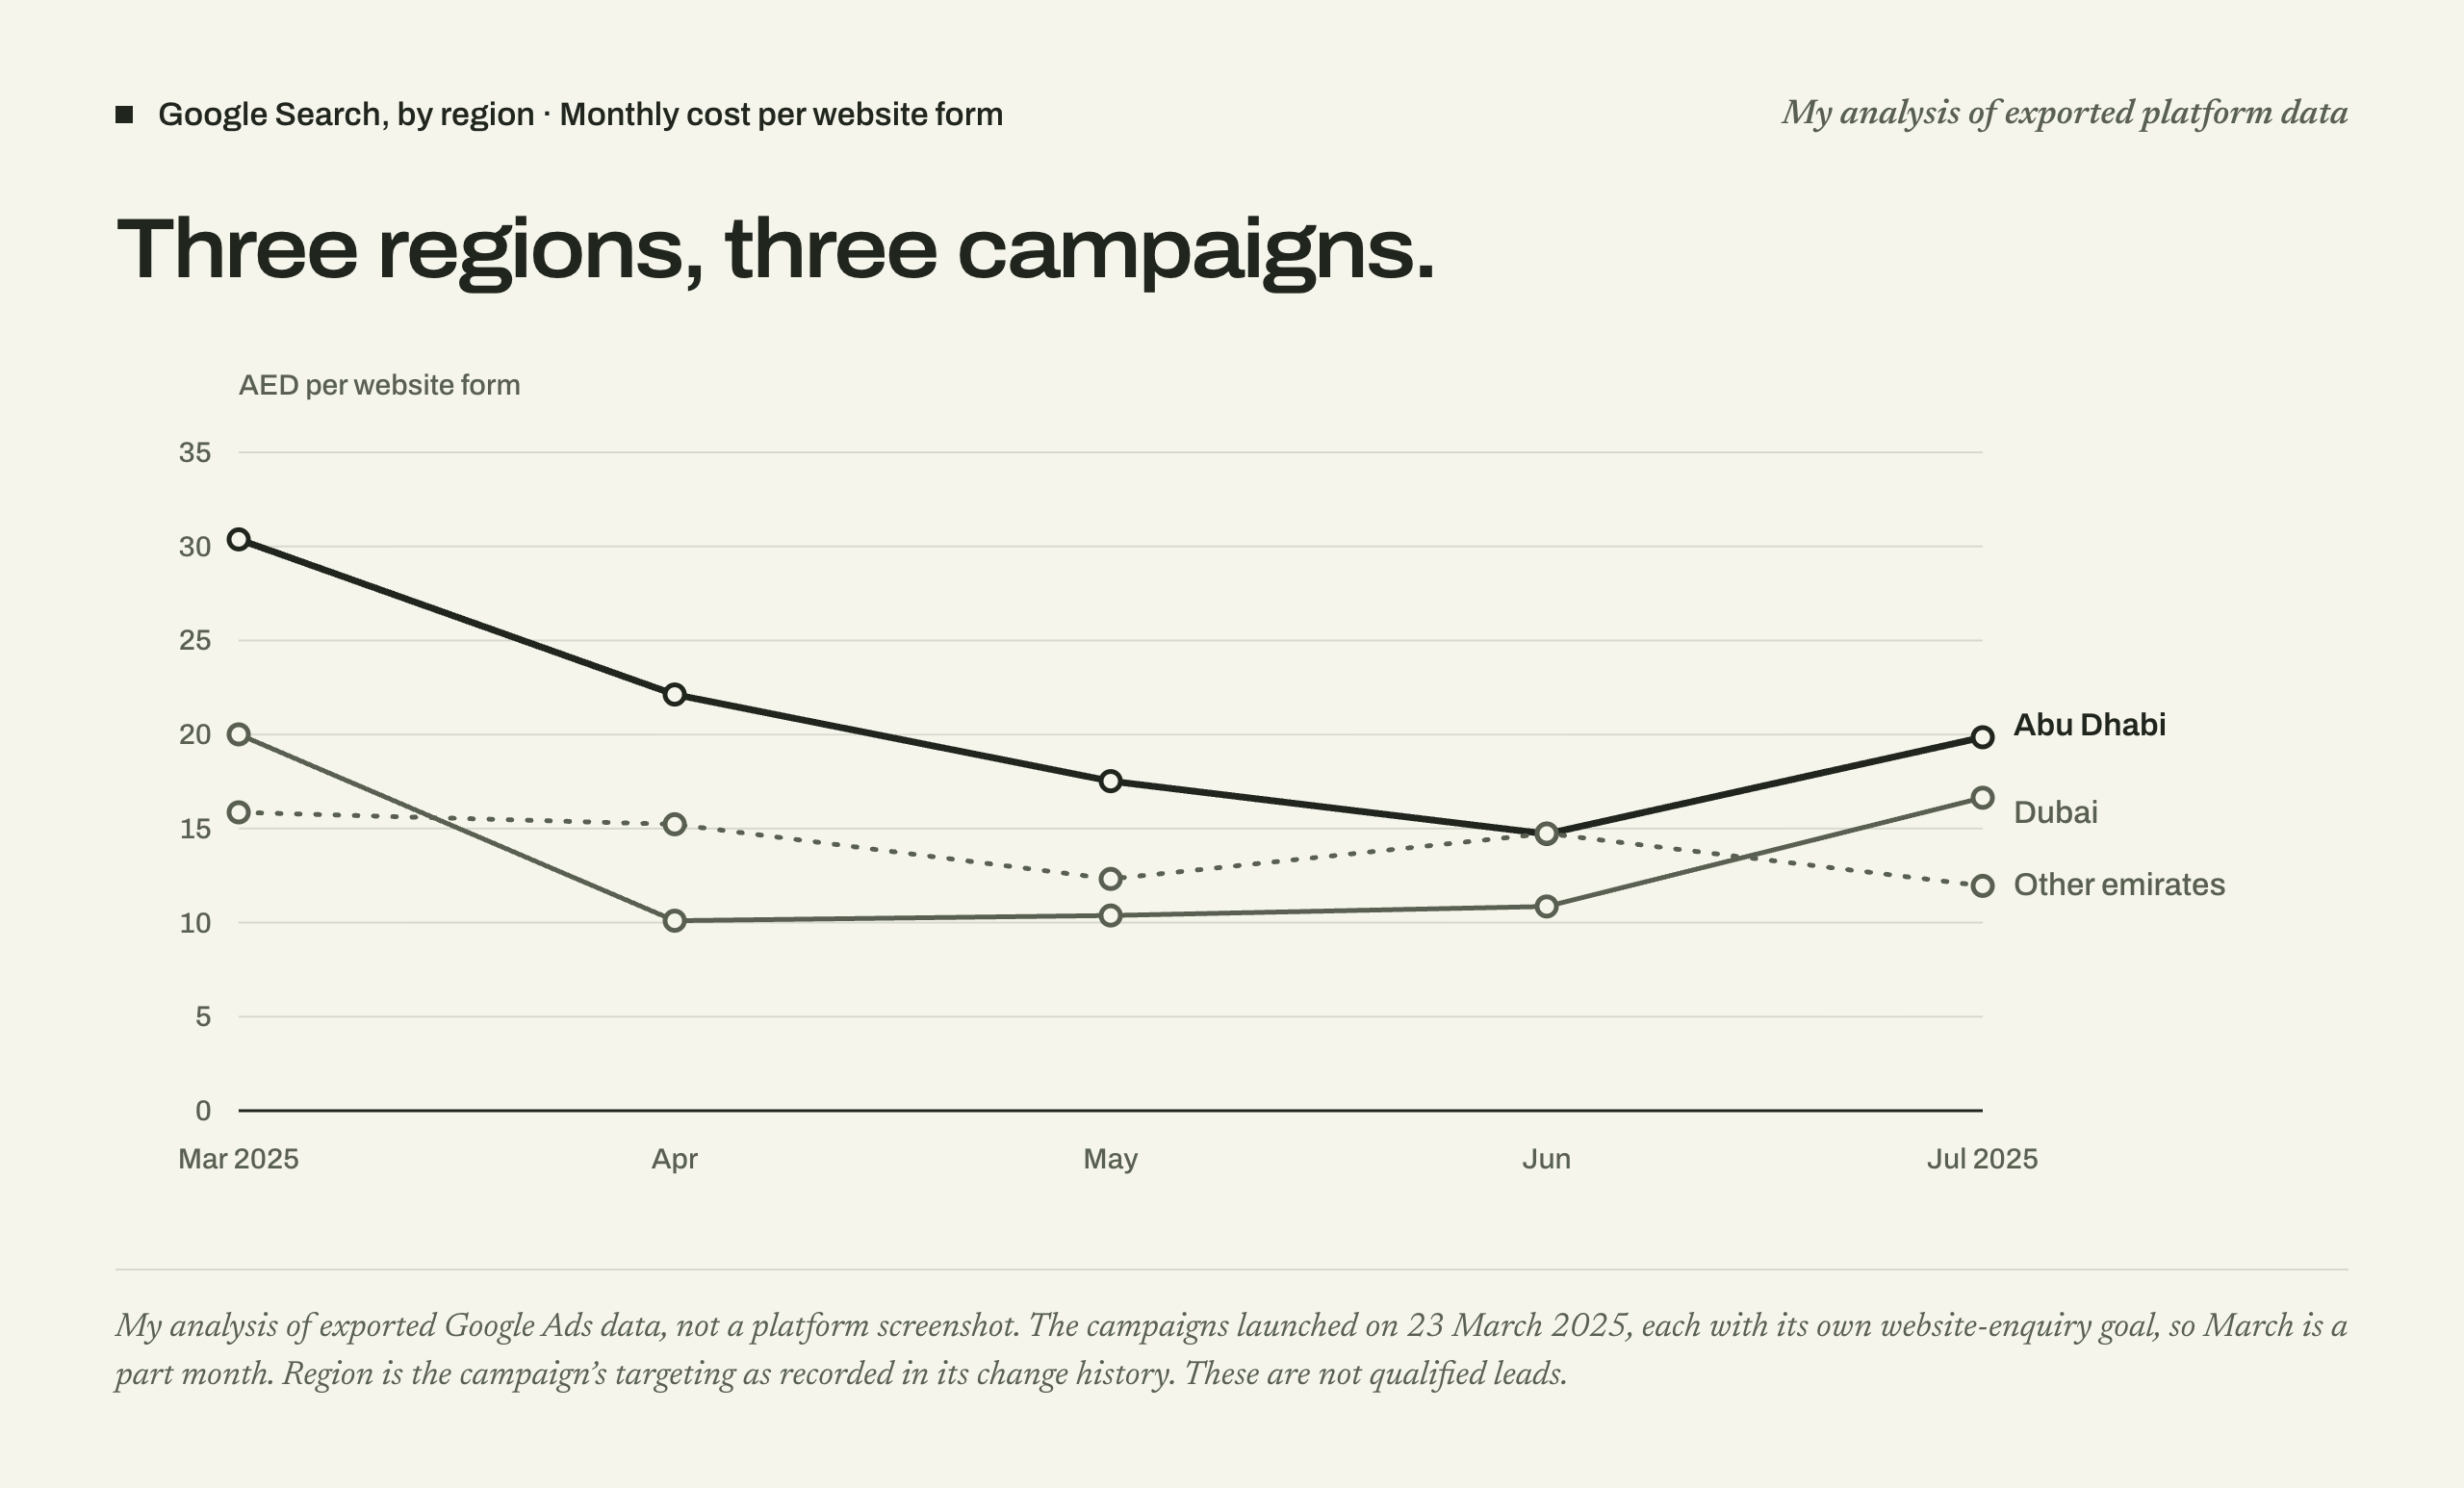
40% lower cost per enquiry in Abu Dhabi.
A separate Search campaign for each region. Two of the three became cheaper per website enquiry, Abu Dhabi by 40%.
Redrawn from Google Ads’ date comparison: cost per conversion, 1 May – 31 Jul 2025 against 22 Mar – 23 Apr 2025. The three Search rows are Dubai, Abu Dhabi and the other emirates. See the platform screenshotMy analysis of exported Google Ads data: monthly cost per website form by region. Not a platform screenshot.
05Google Performance Max
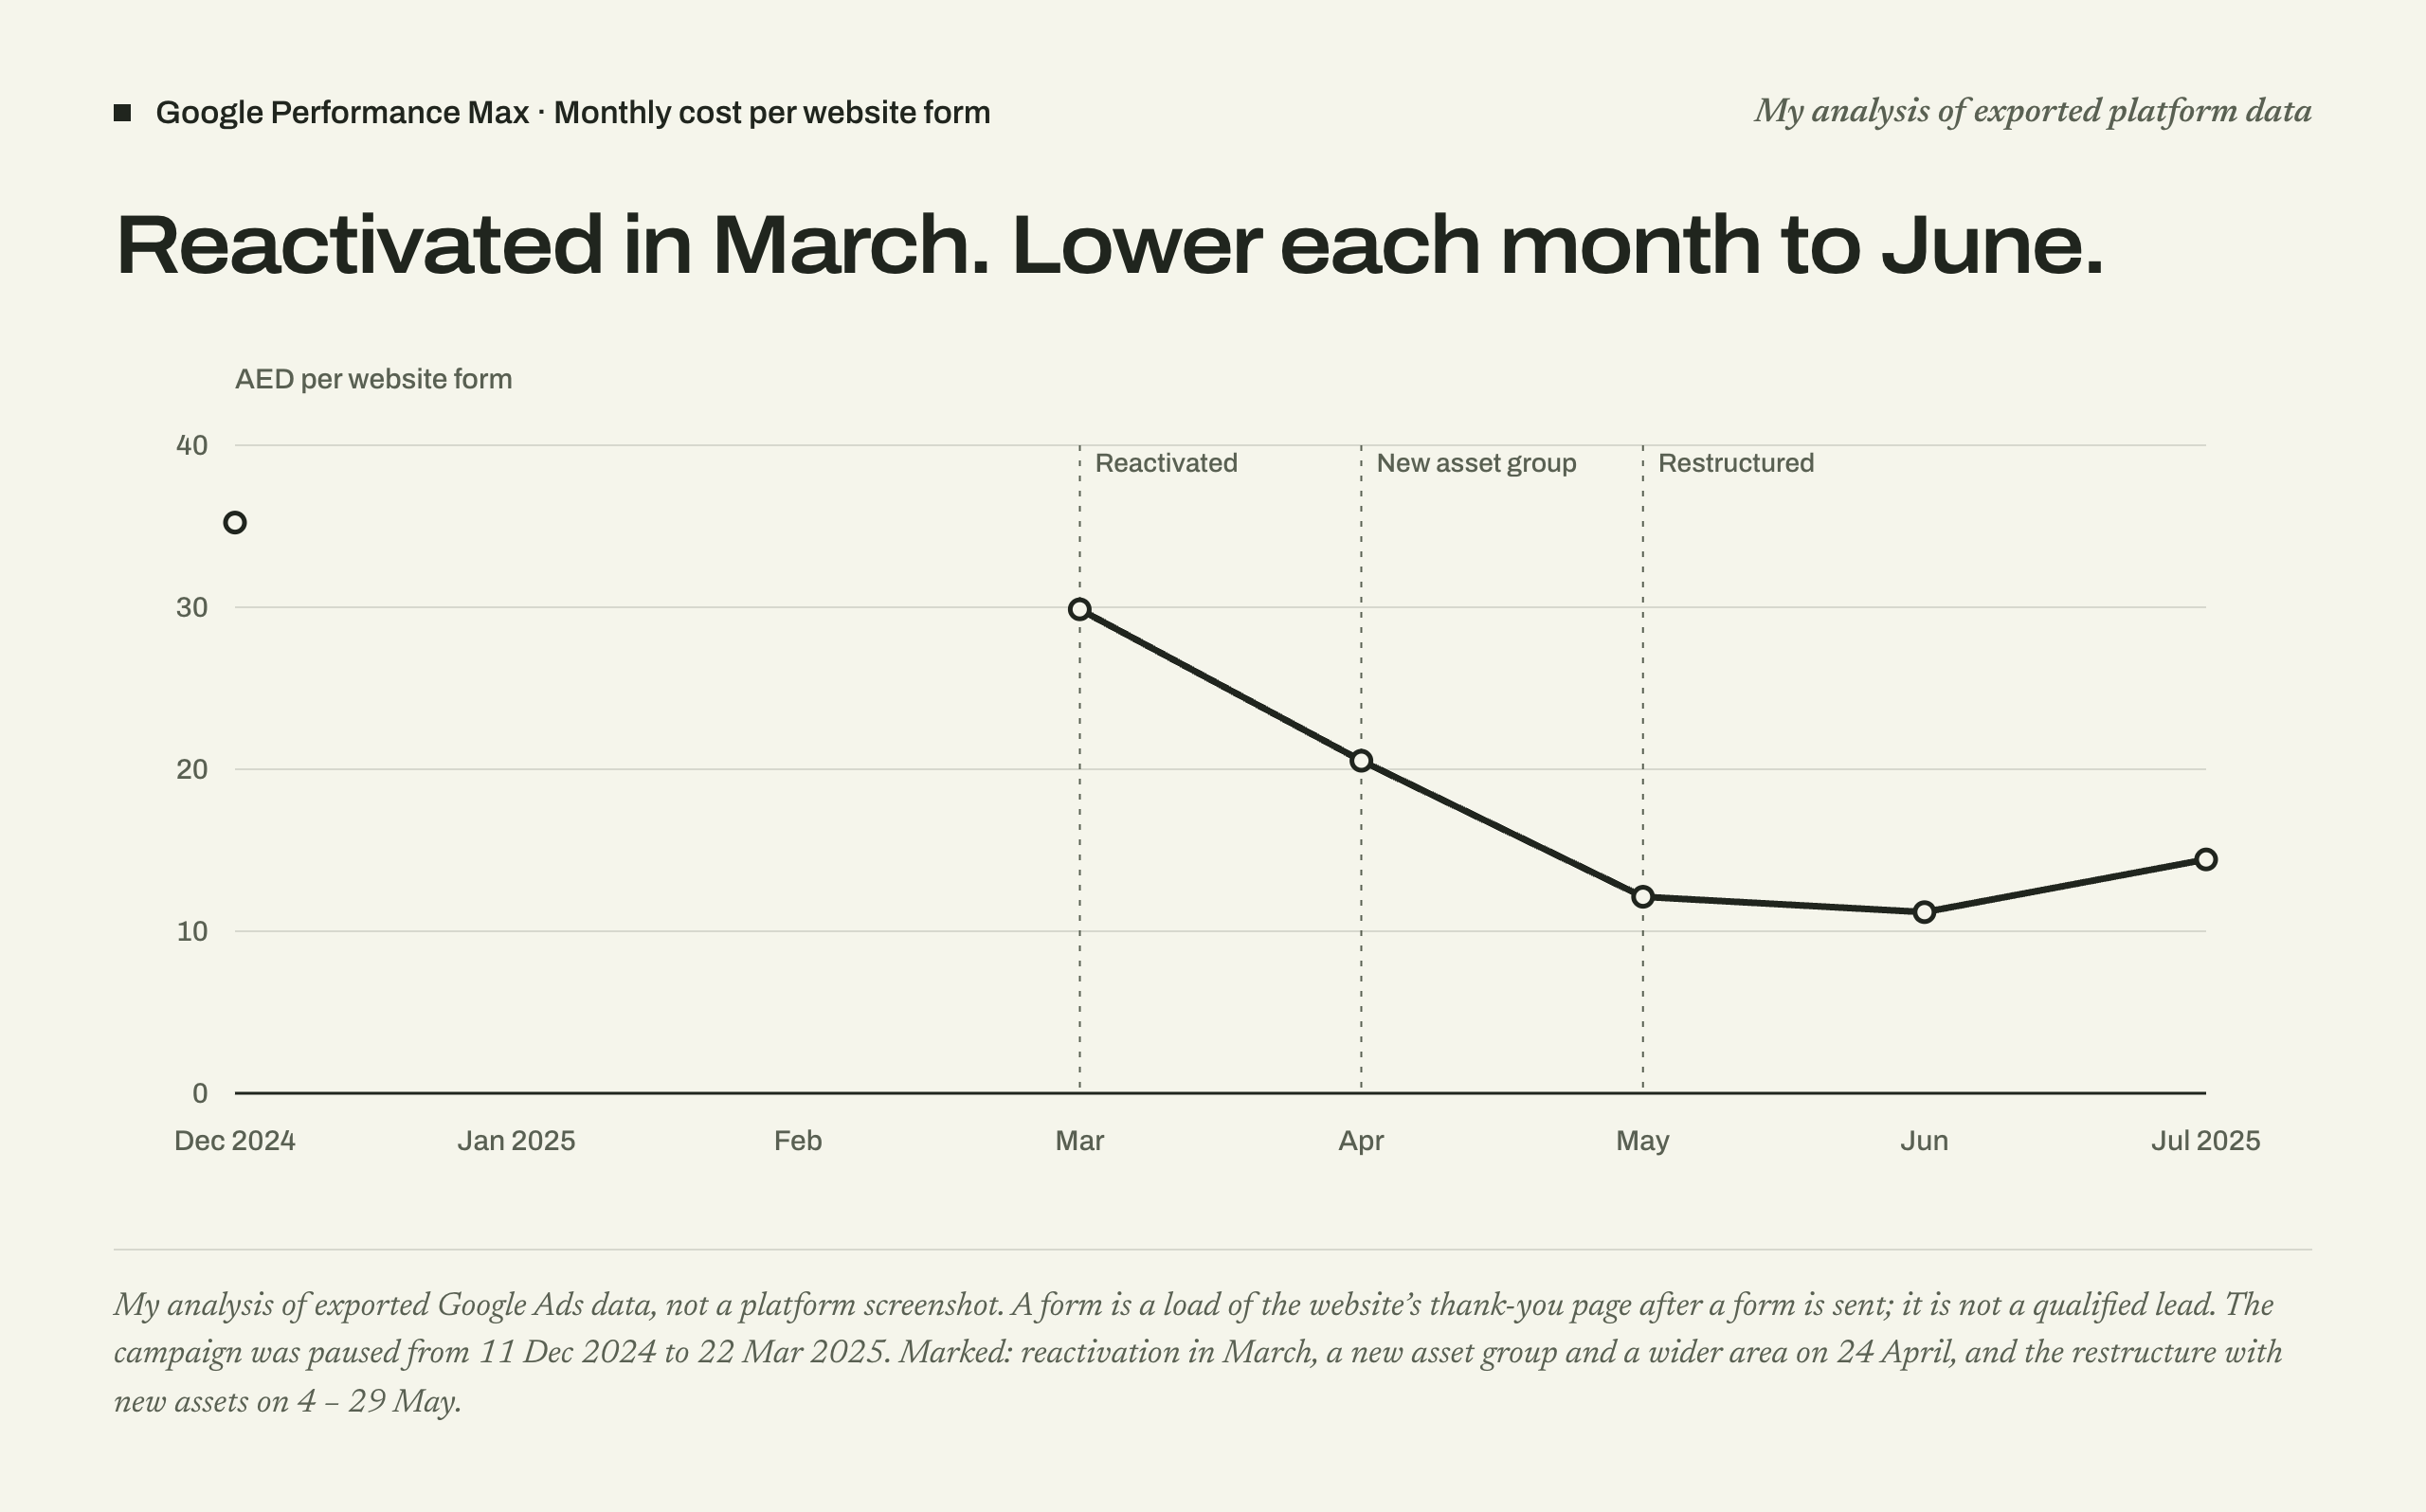
45% lower cost per website enquiry.
A paused Performance Max campaign, reactivated and restructured. The cost of a website enquiry fell 45%.
Redrawn from Google Ads’ date comparison: cost per conversion, 1 May – 31 Jul 2025 against 22 Mar – 23 Apr 2025. The first row is the Performance Max campaign. See the platform screenshotMy analysis of exported Google Ads data: monthly cost per website form, with dated changes. Not a platform screenshot.
Part two. The enquiry
Know what a lead is worth.
Four tools, each built to answer one question. Where do enquiries go? What needs attention today? Which leads were worth their cost? Where is this shipment?
06CRM reporting
Where did the enquiries go?
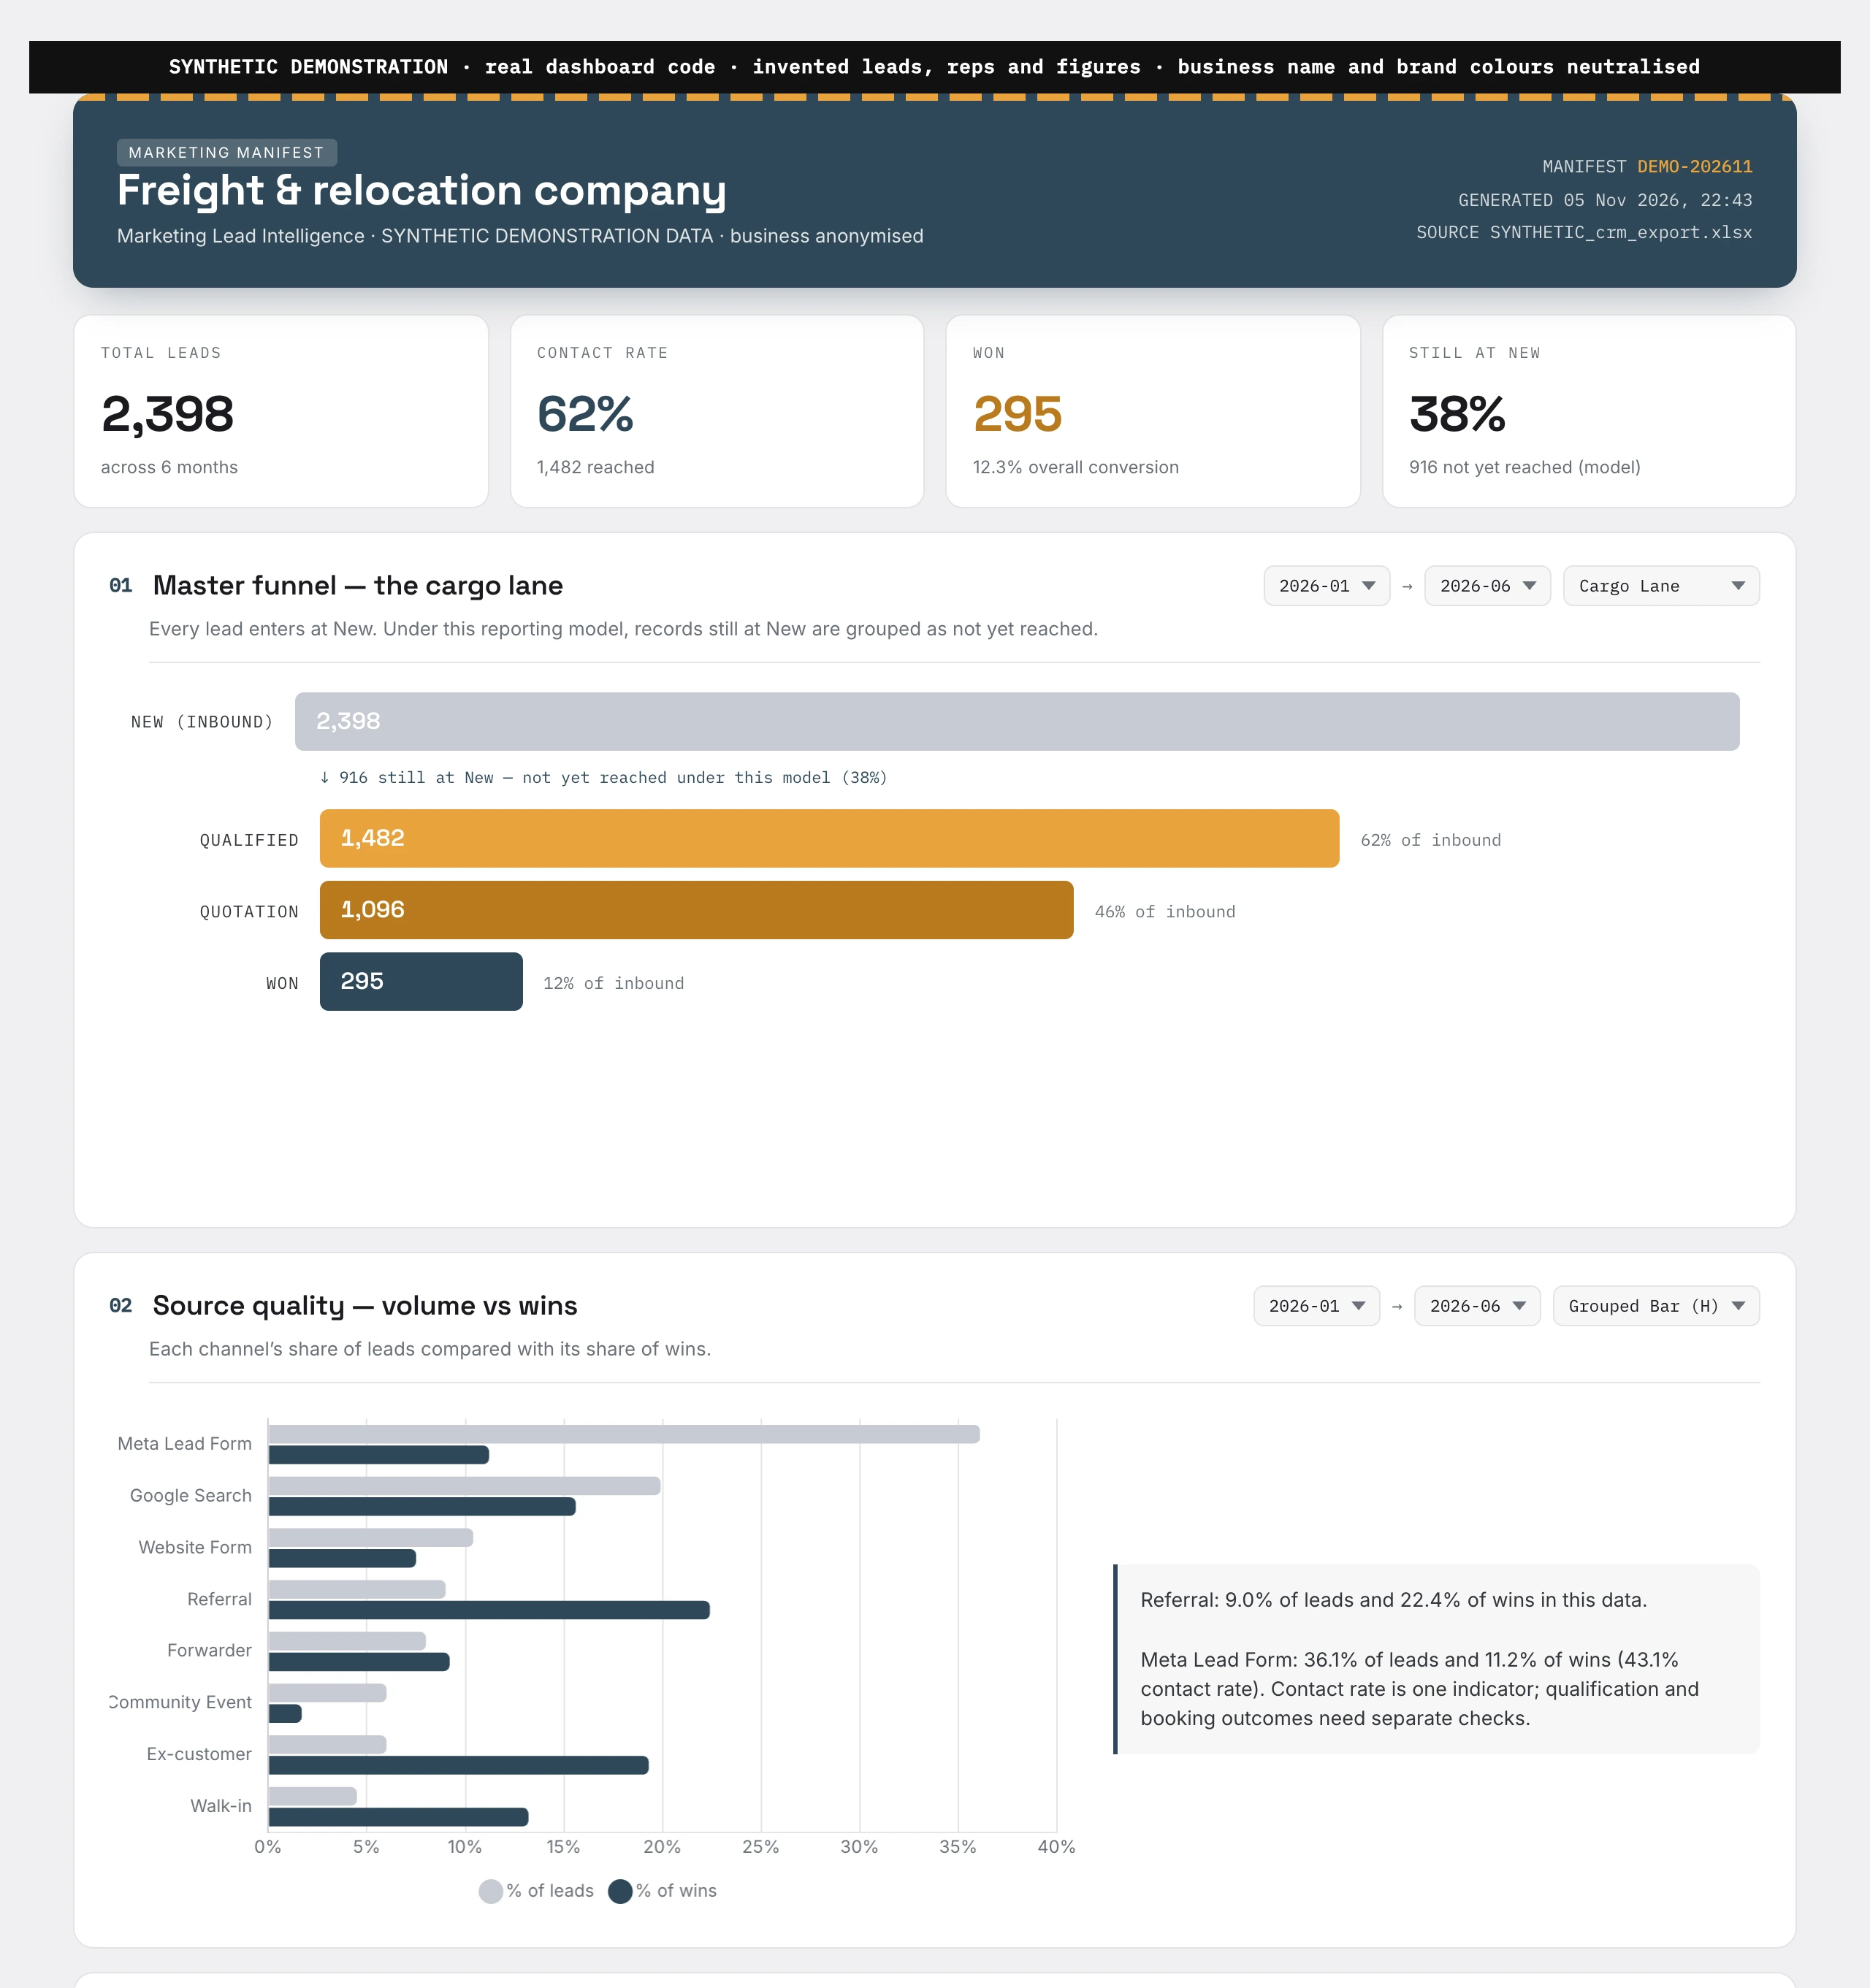
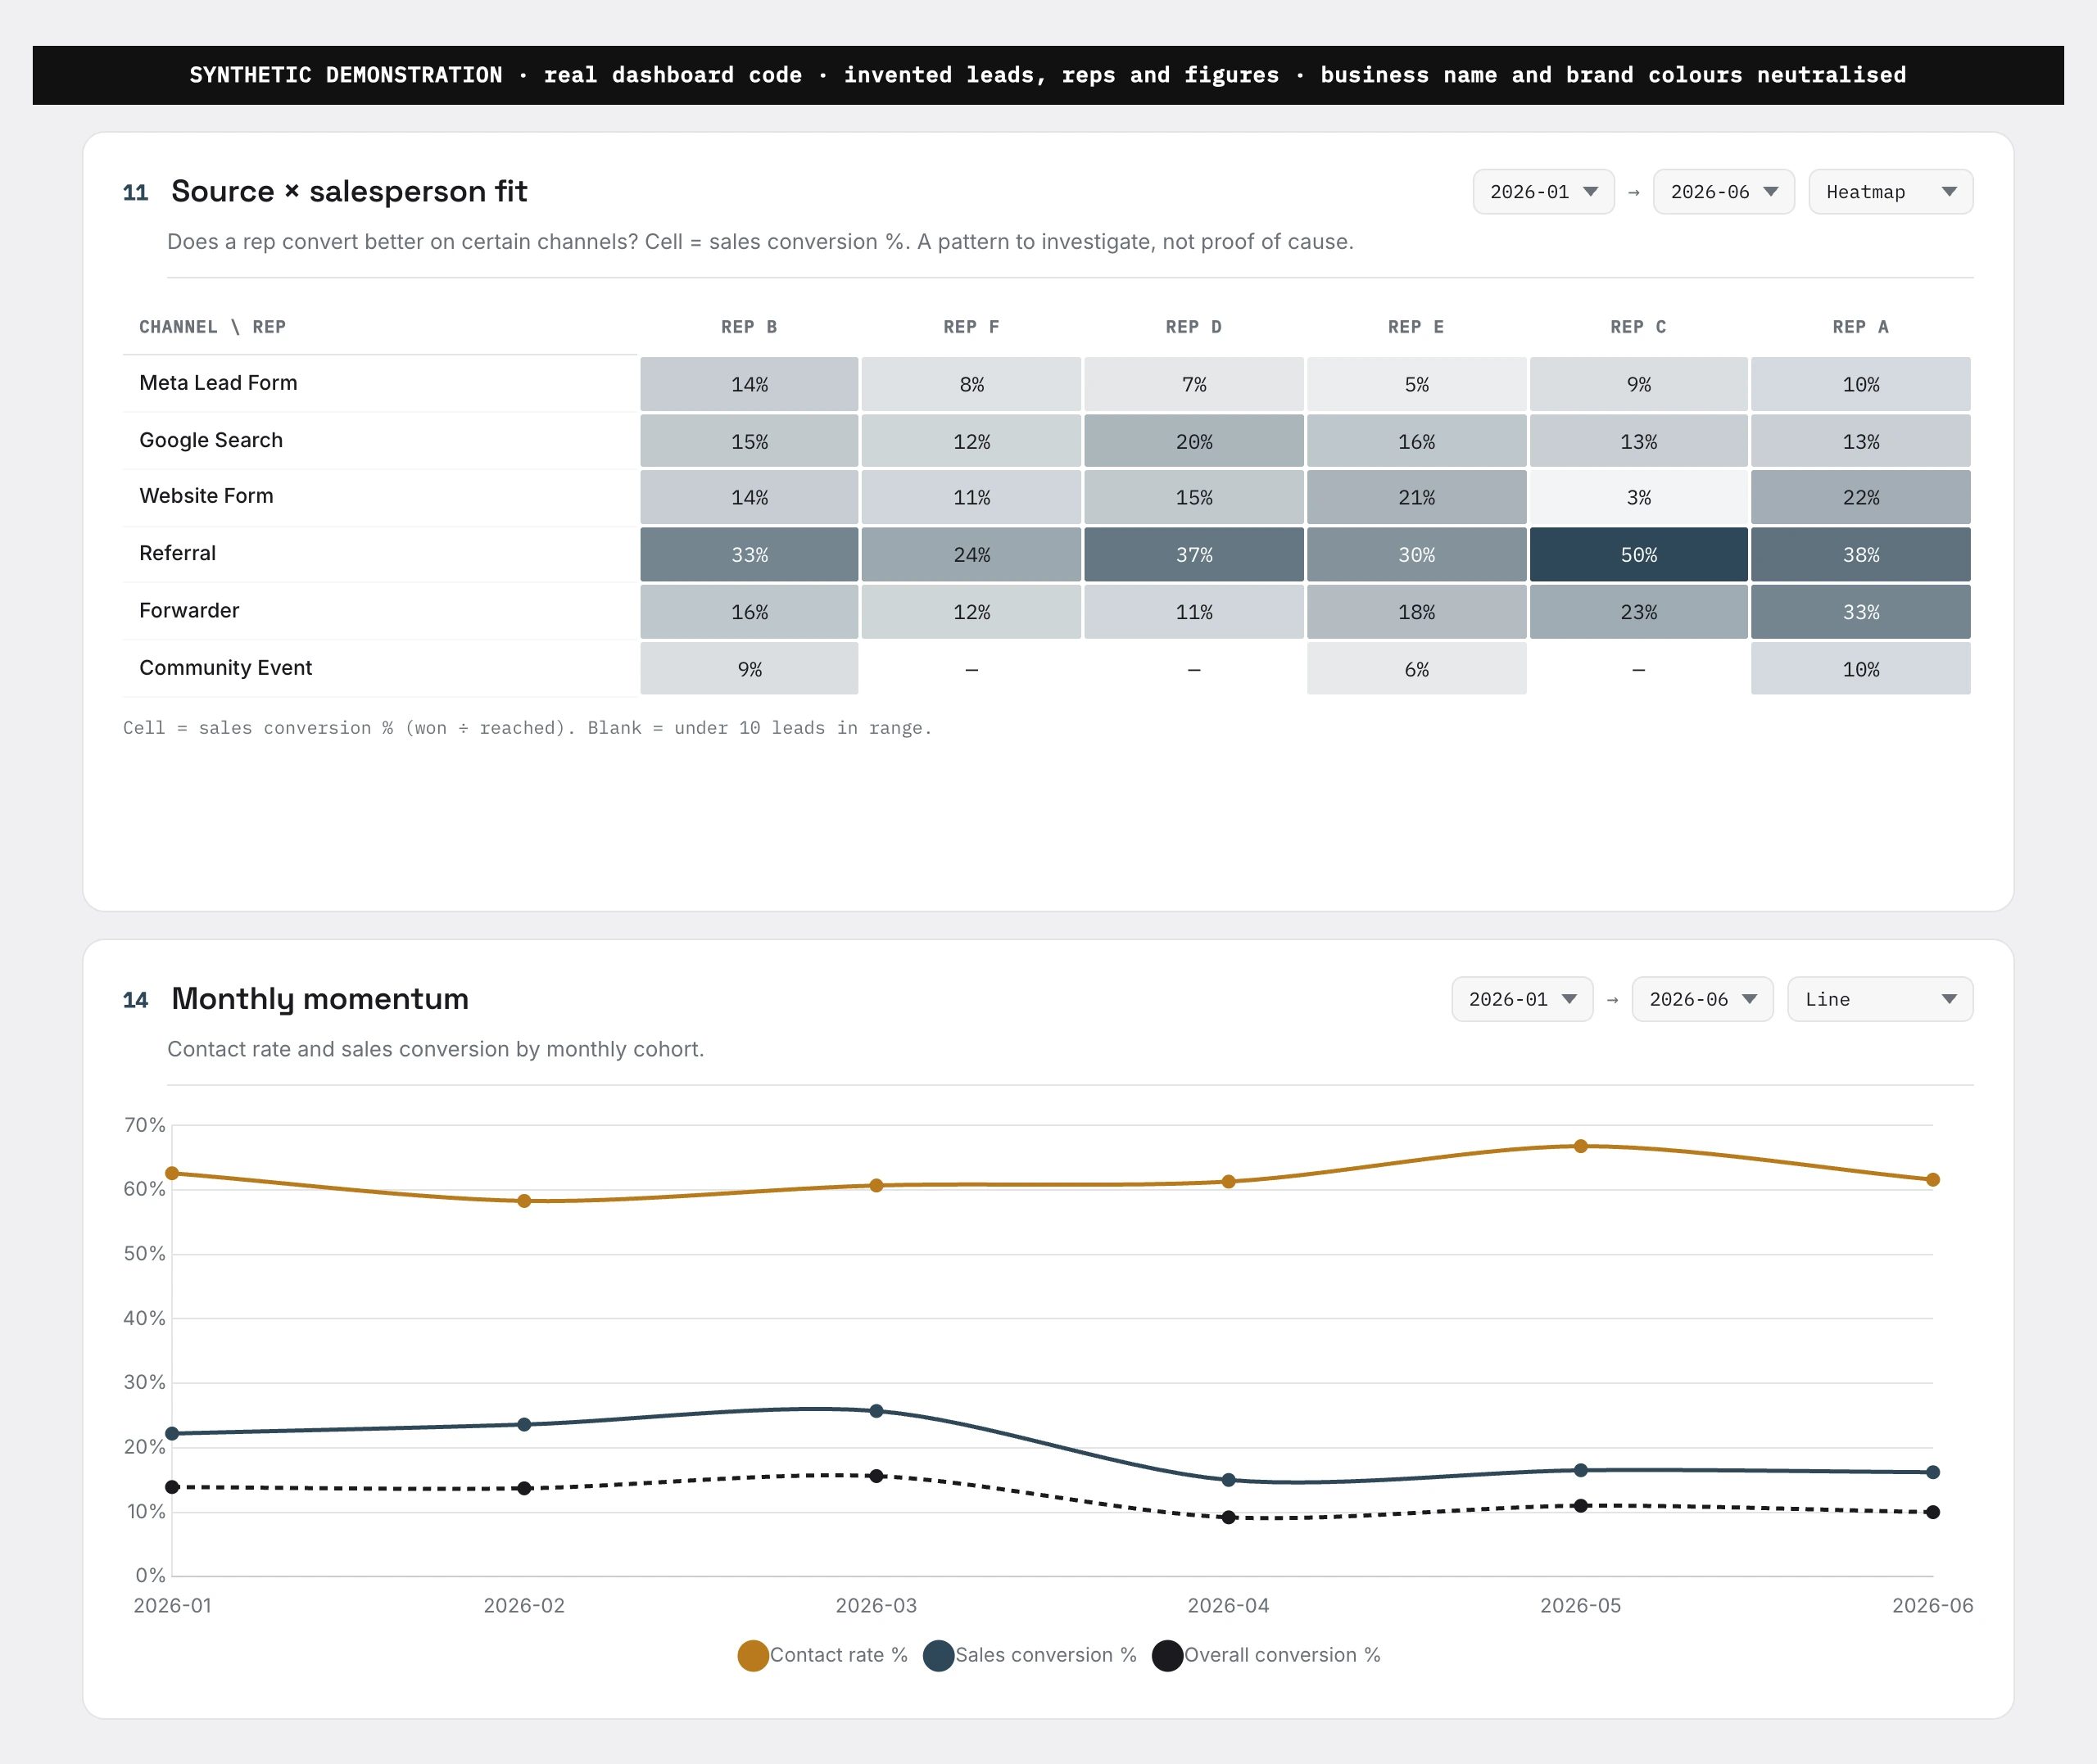
Where do enquiries come from, where do they stall, and which are won? One reporting tool answers all three. I set the rules, built it with AI assistance and kept it in use.
Measurement rules, report design and AI-assisted implementation
Demonstration with synthetic data. The dashboard compares lead stages and shows how each source contributes to enquiries and wins.Demonstration with synthetic data. The report groups conversion rates by channel and salesperson and leaves small samples blank.
07Odoo KPI dashboard
A clearer view of the day.
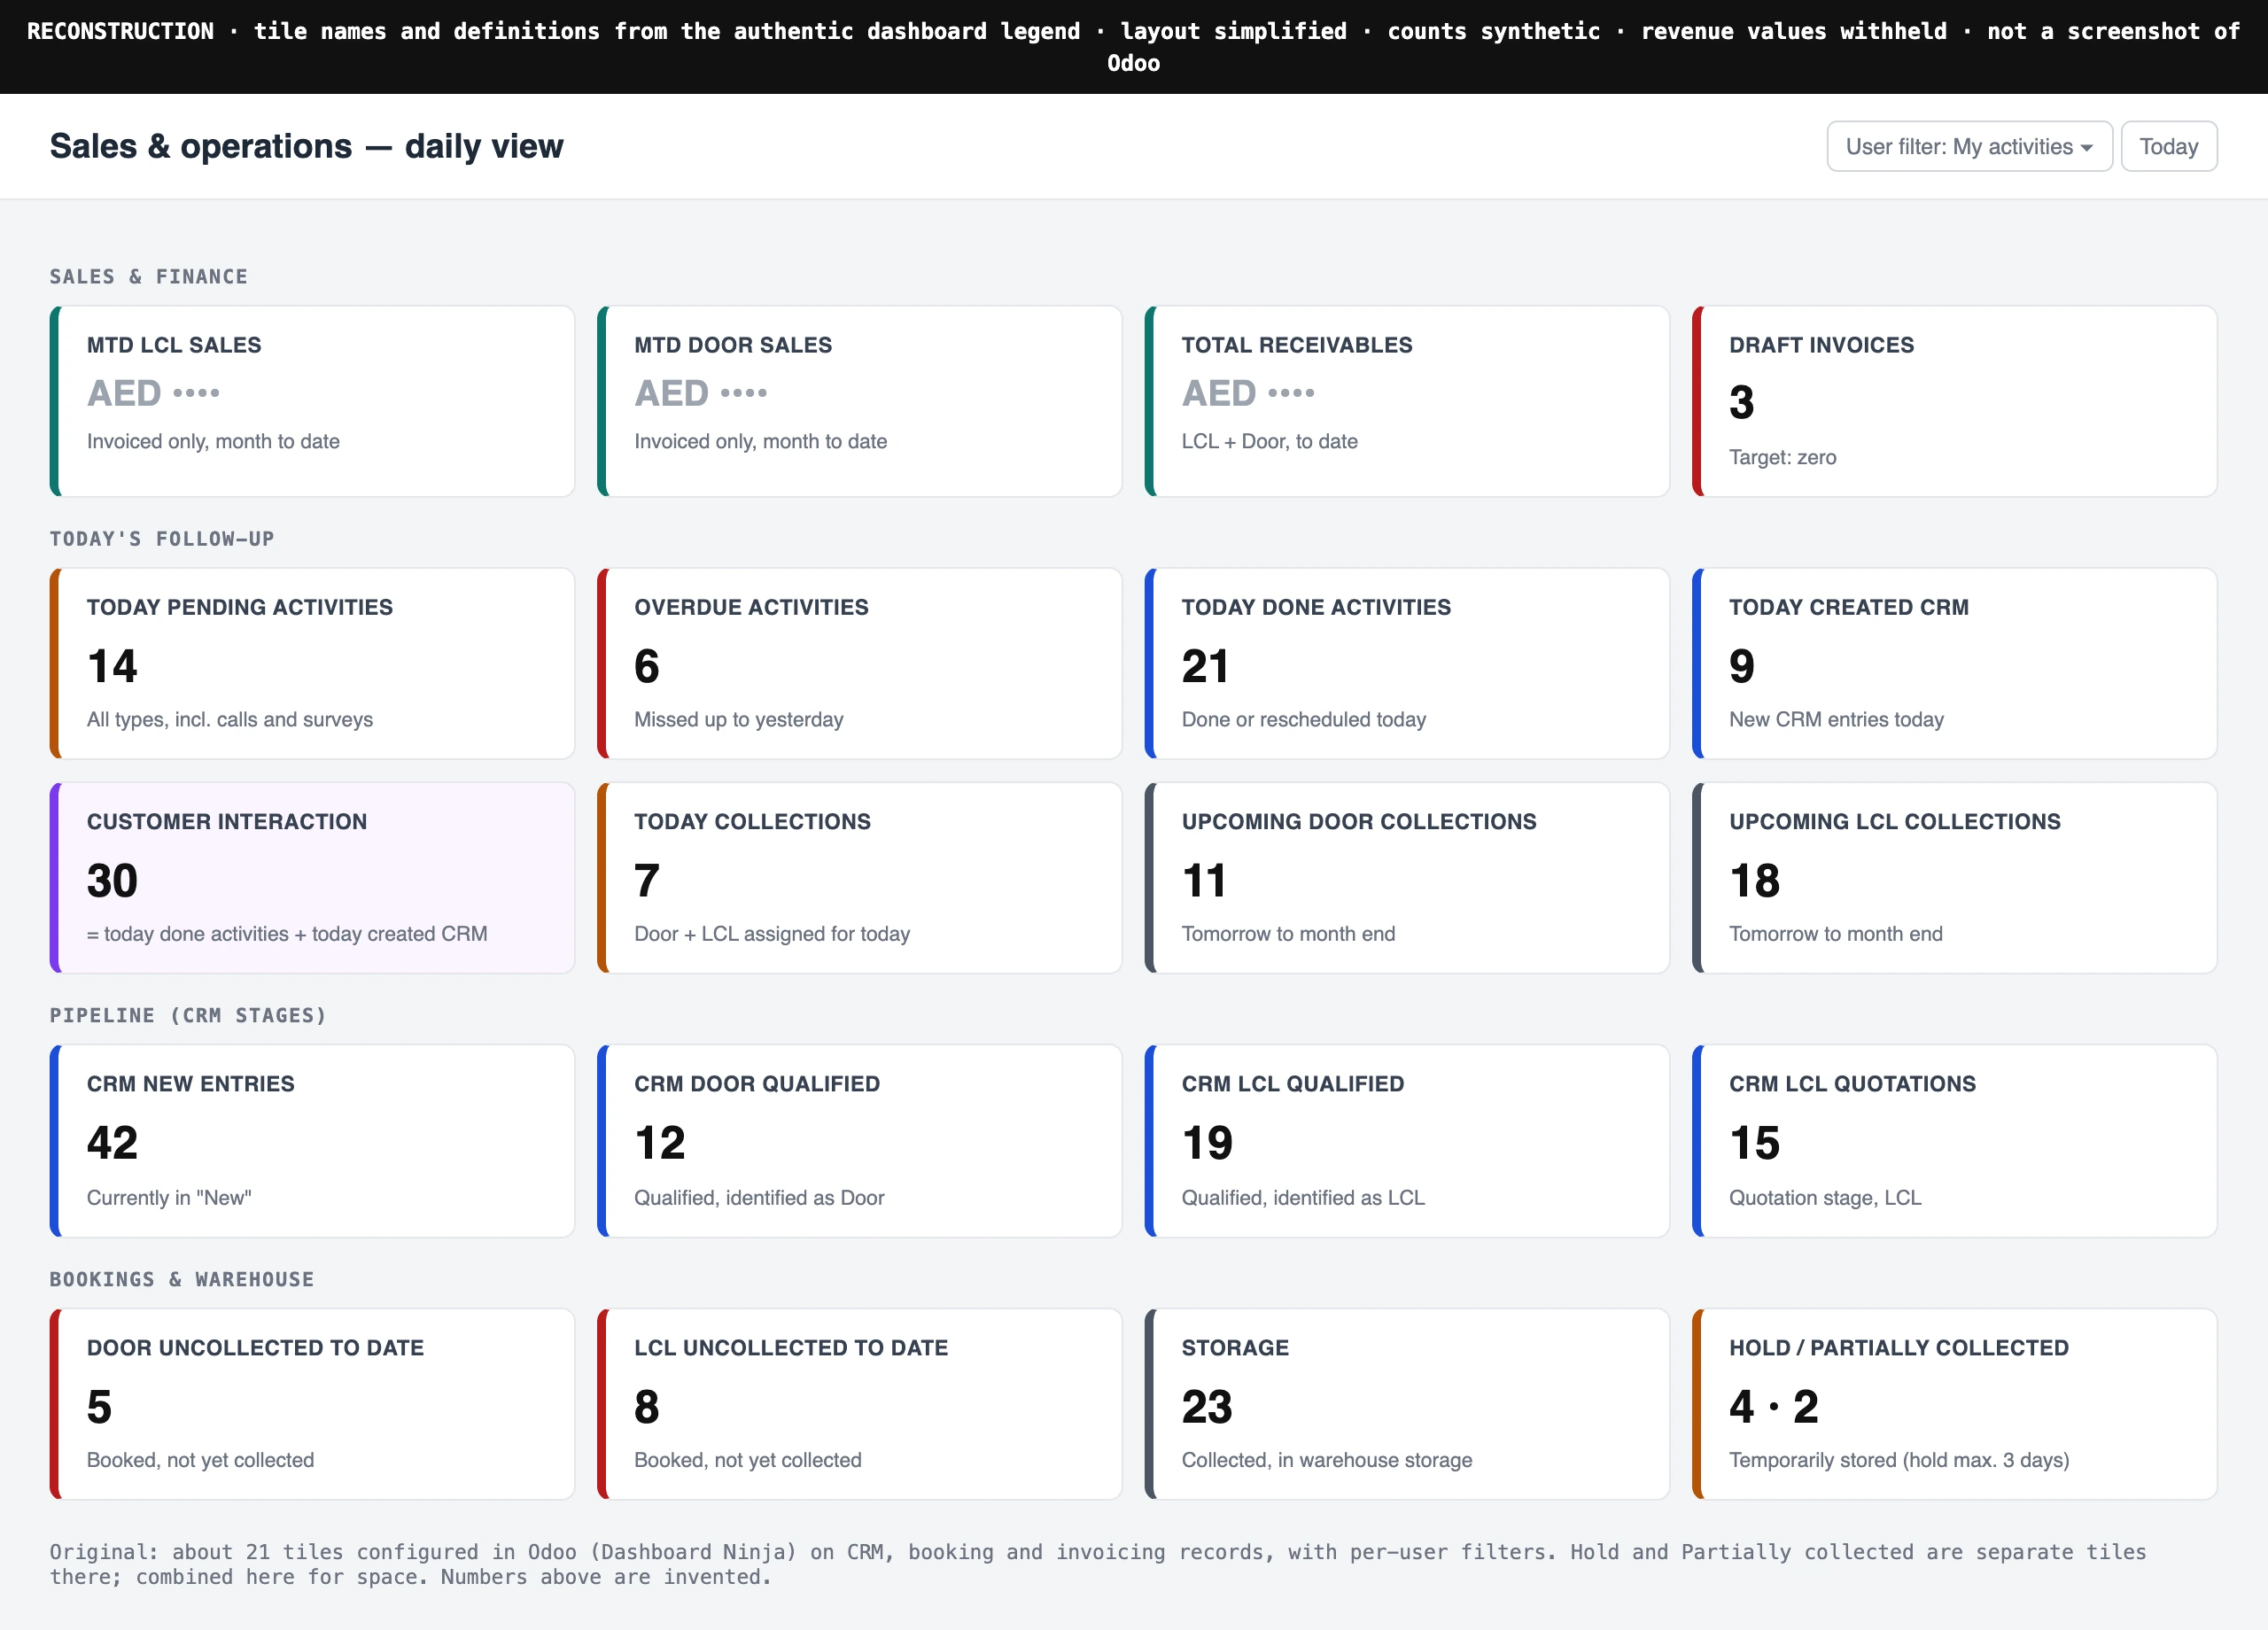
What needs attention today? One screen for the day’s follow-ups, pipeline, bookings and collections. I defined the KPIs and configured it in Odoo.
KPI definitions, dashboard configuration and filters
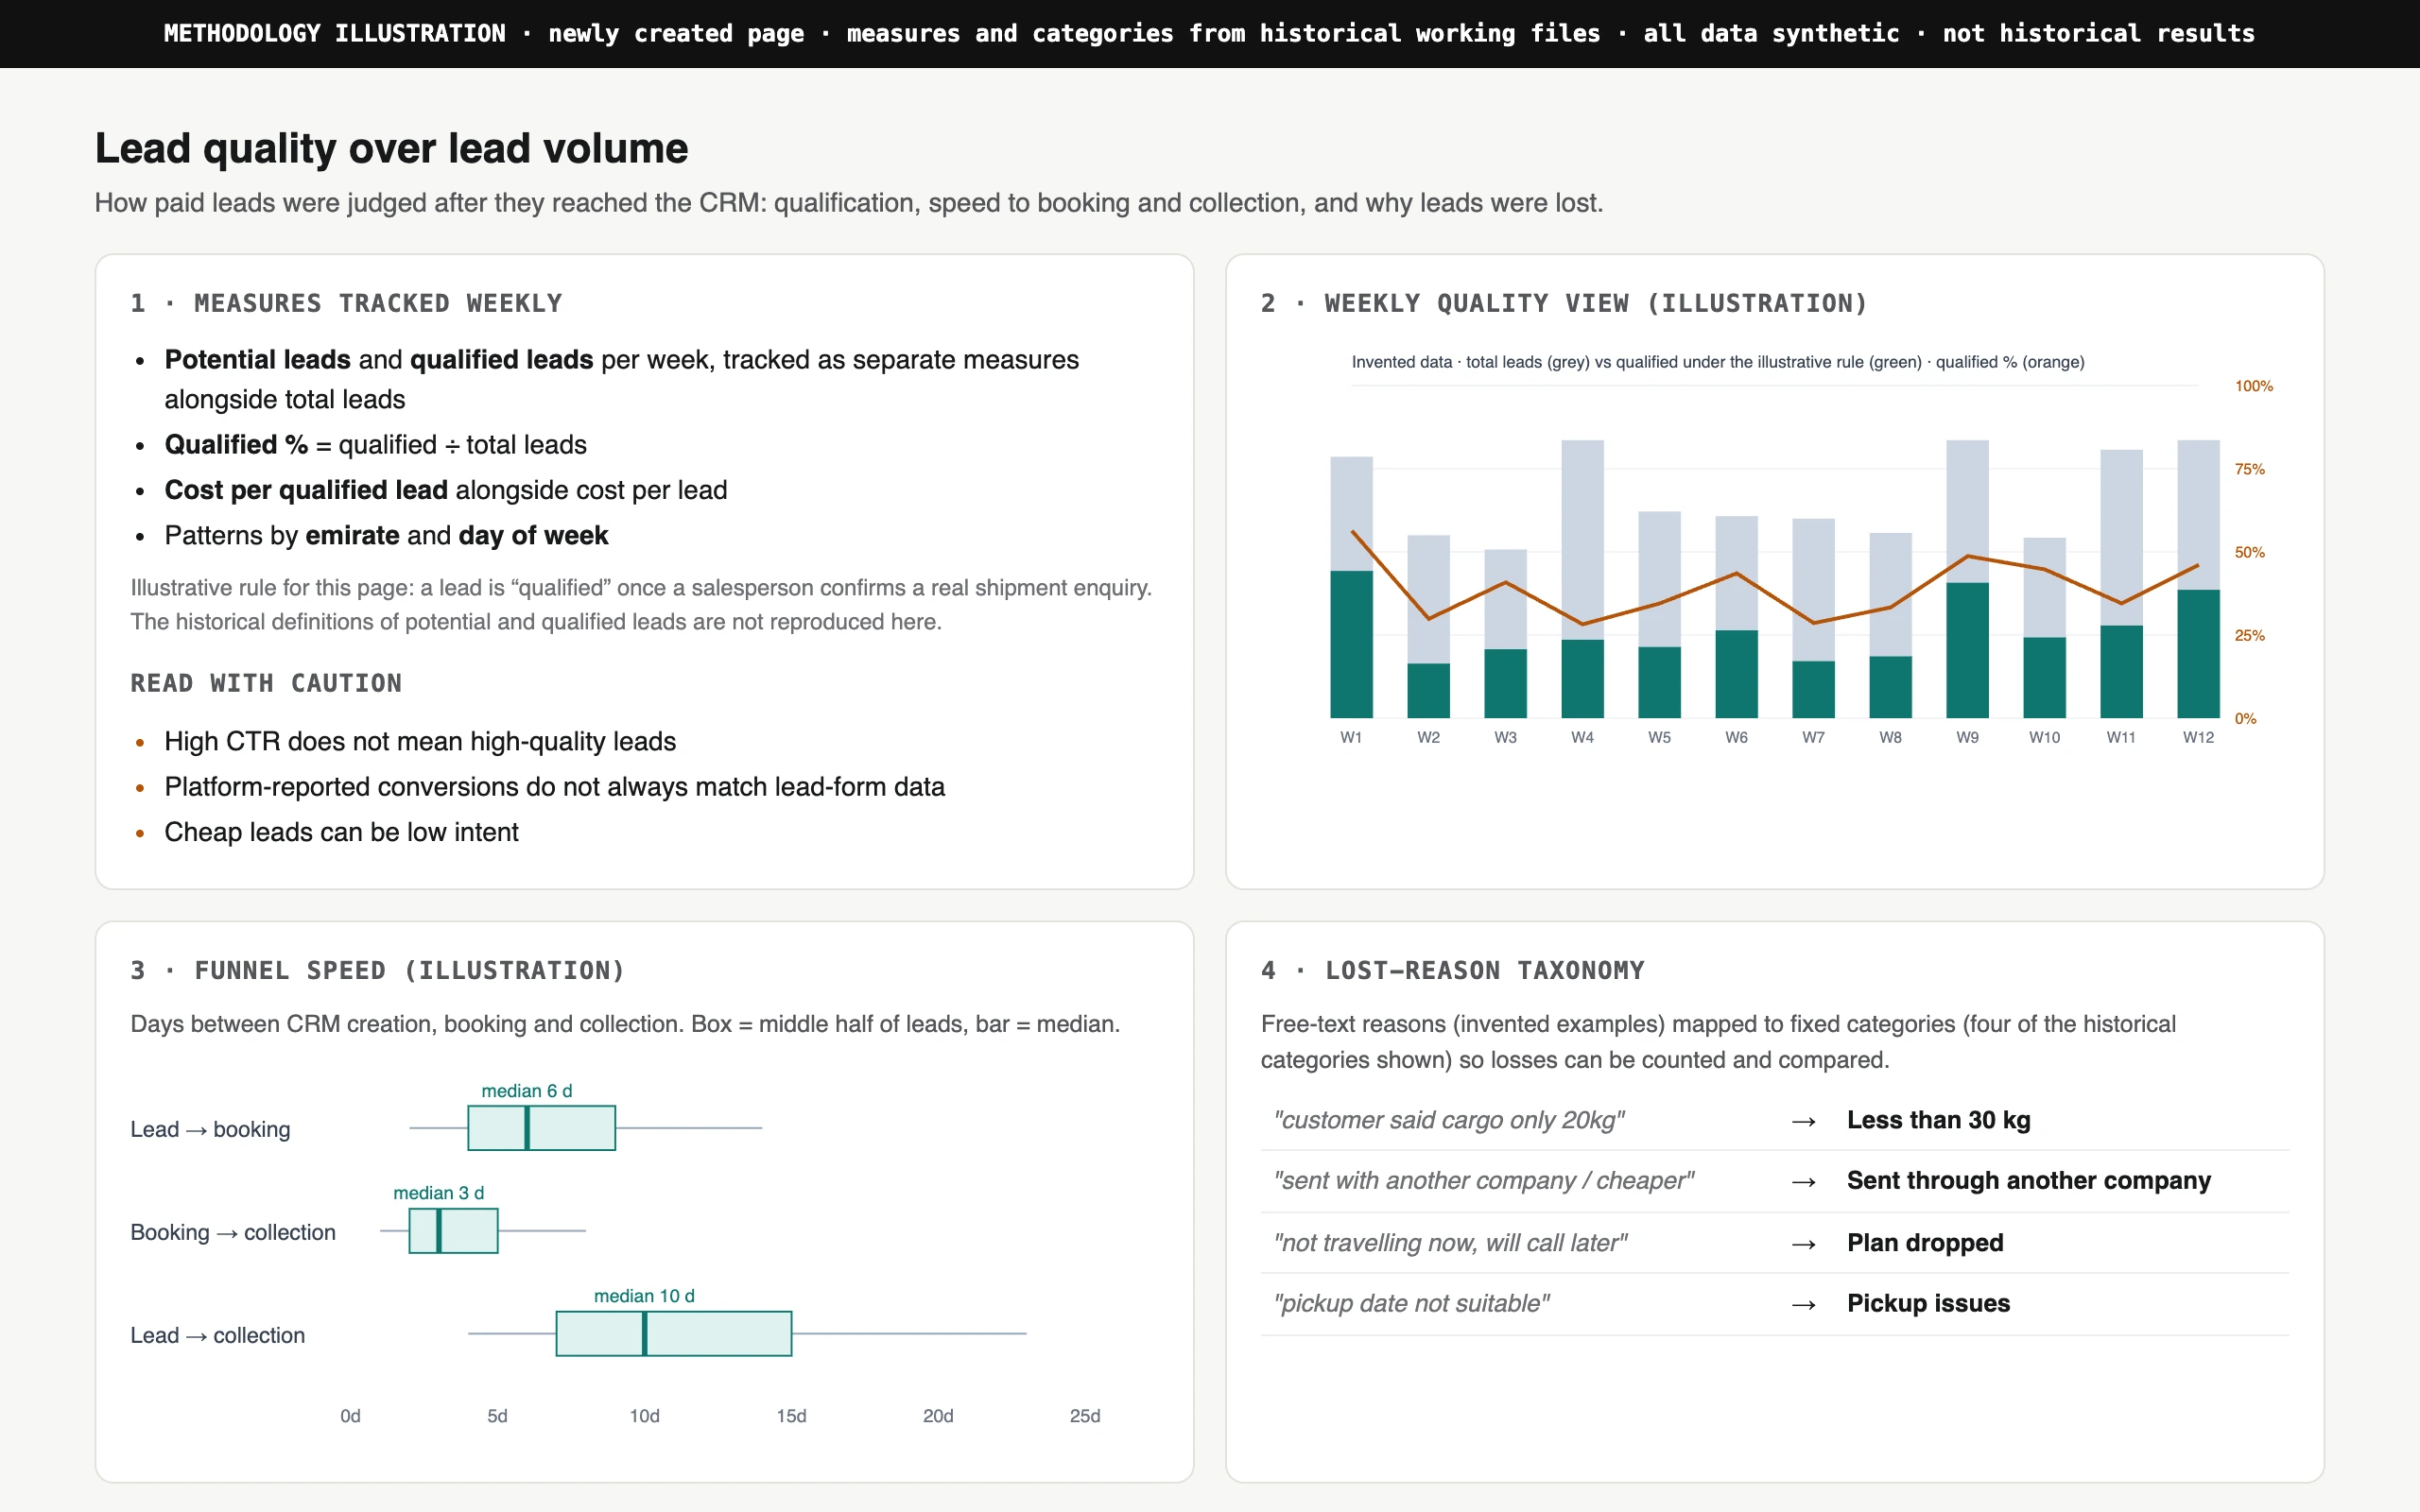
Methodology illustration with synthetic data. The example qualification rule and figures are illustrative.
09Inventory portal
Find it. Check it. Move it.
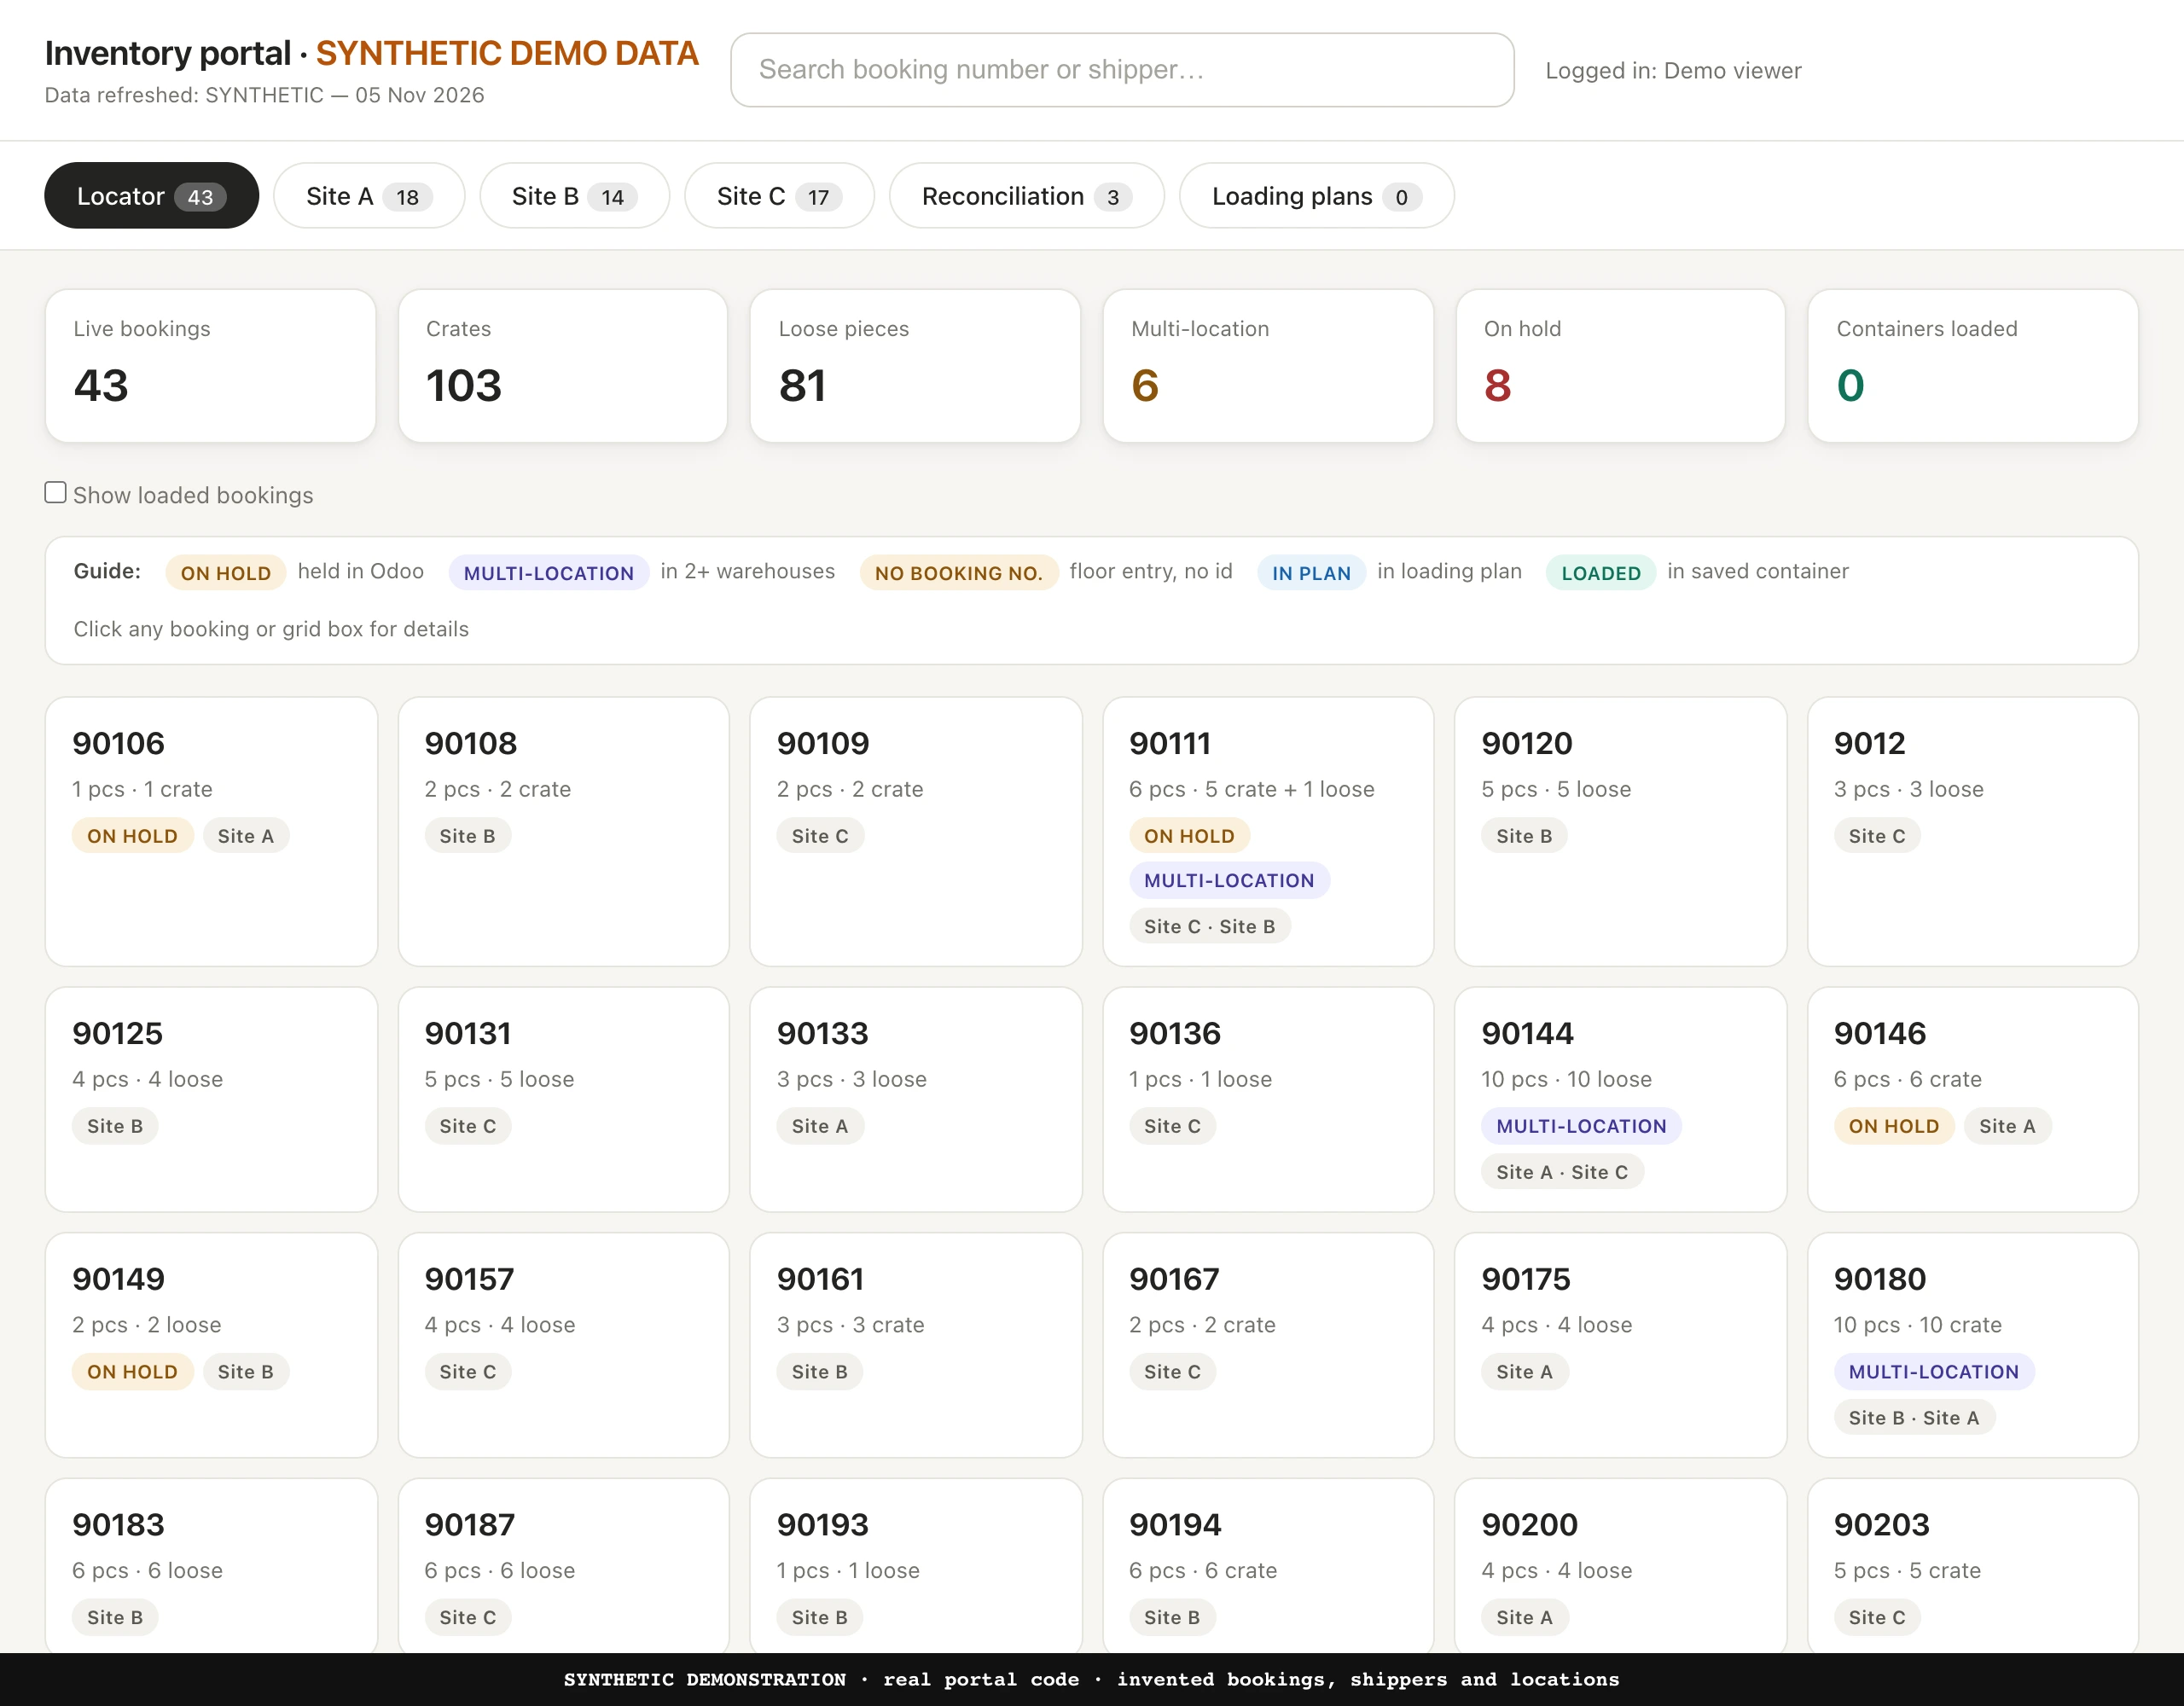
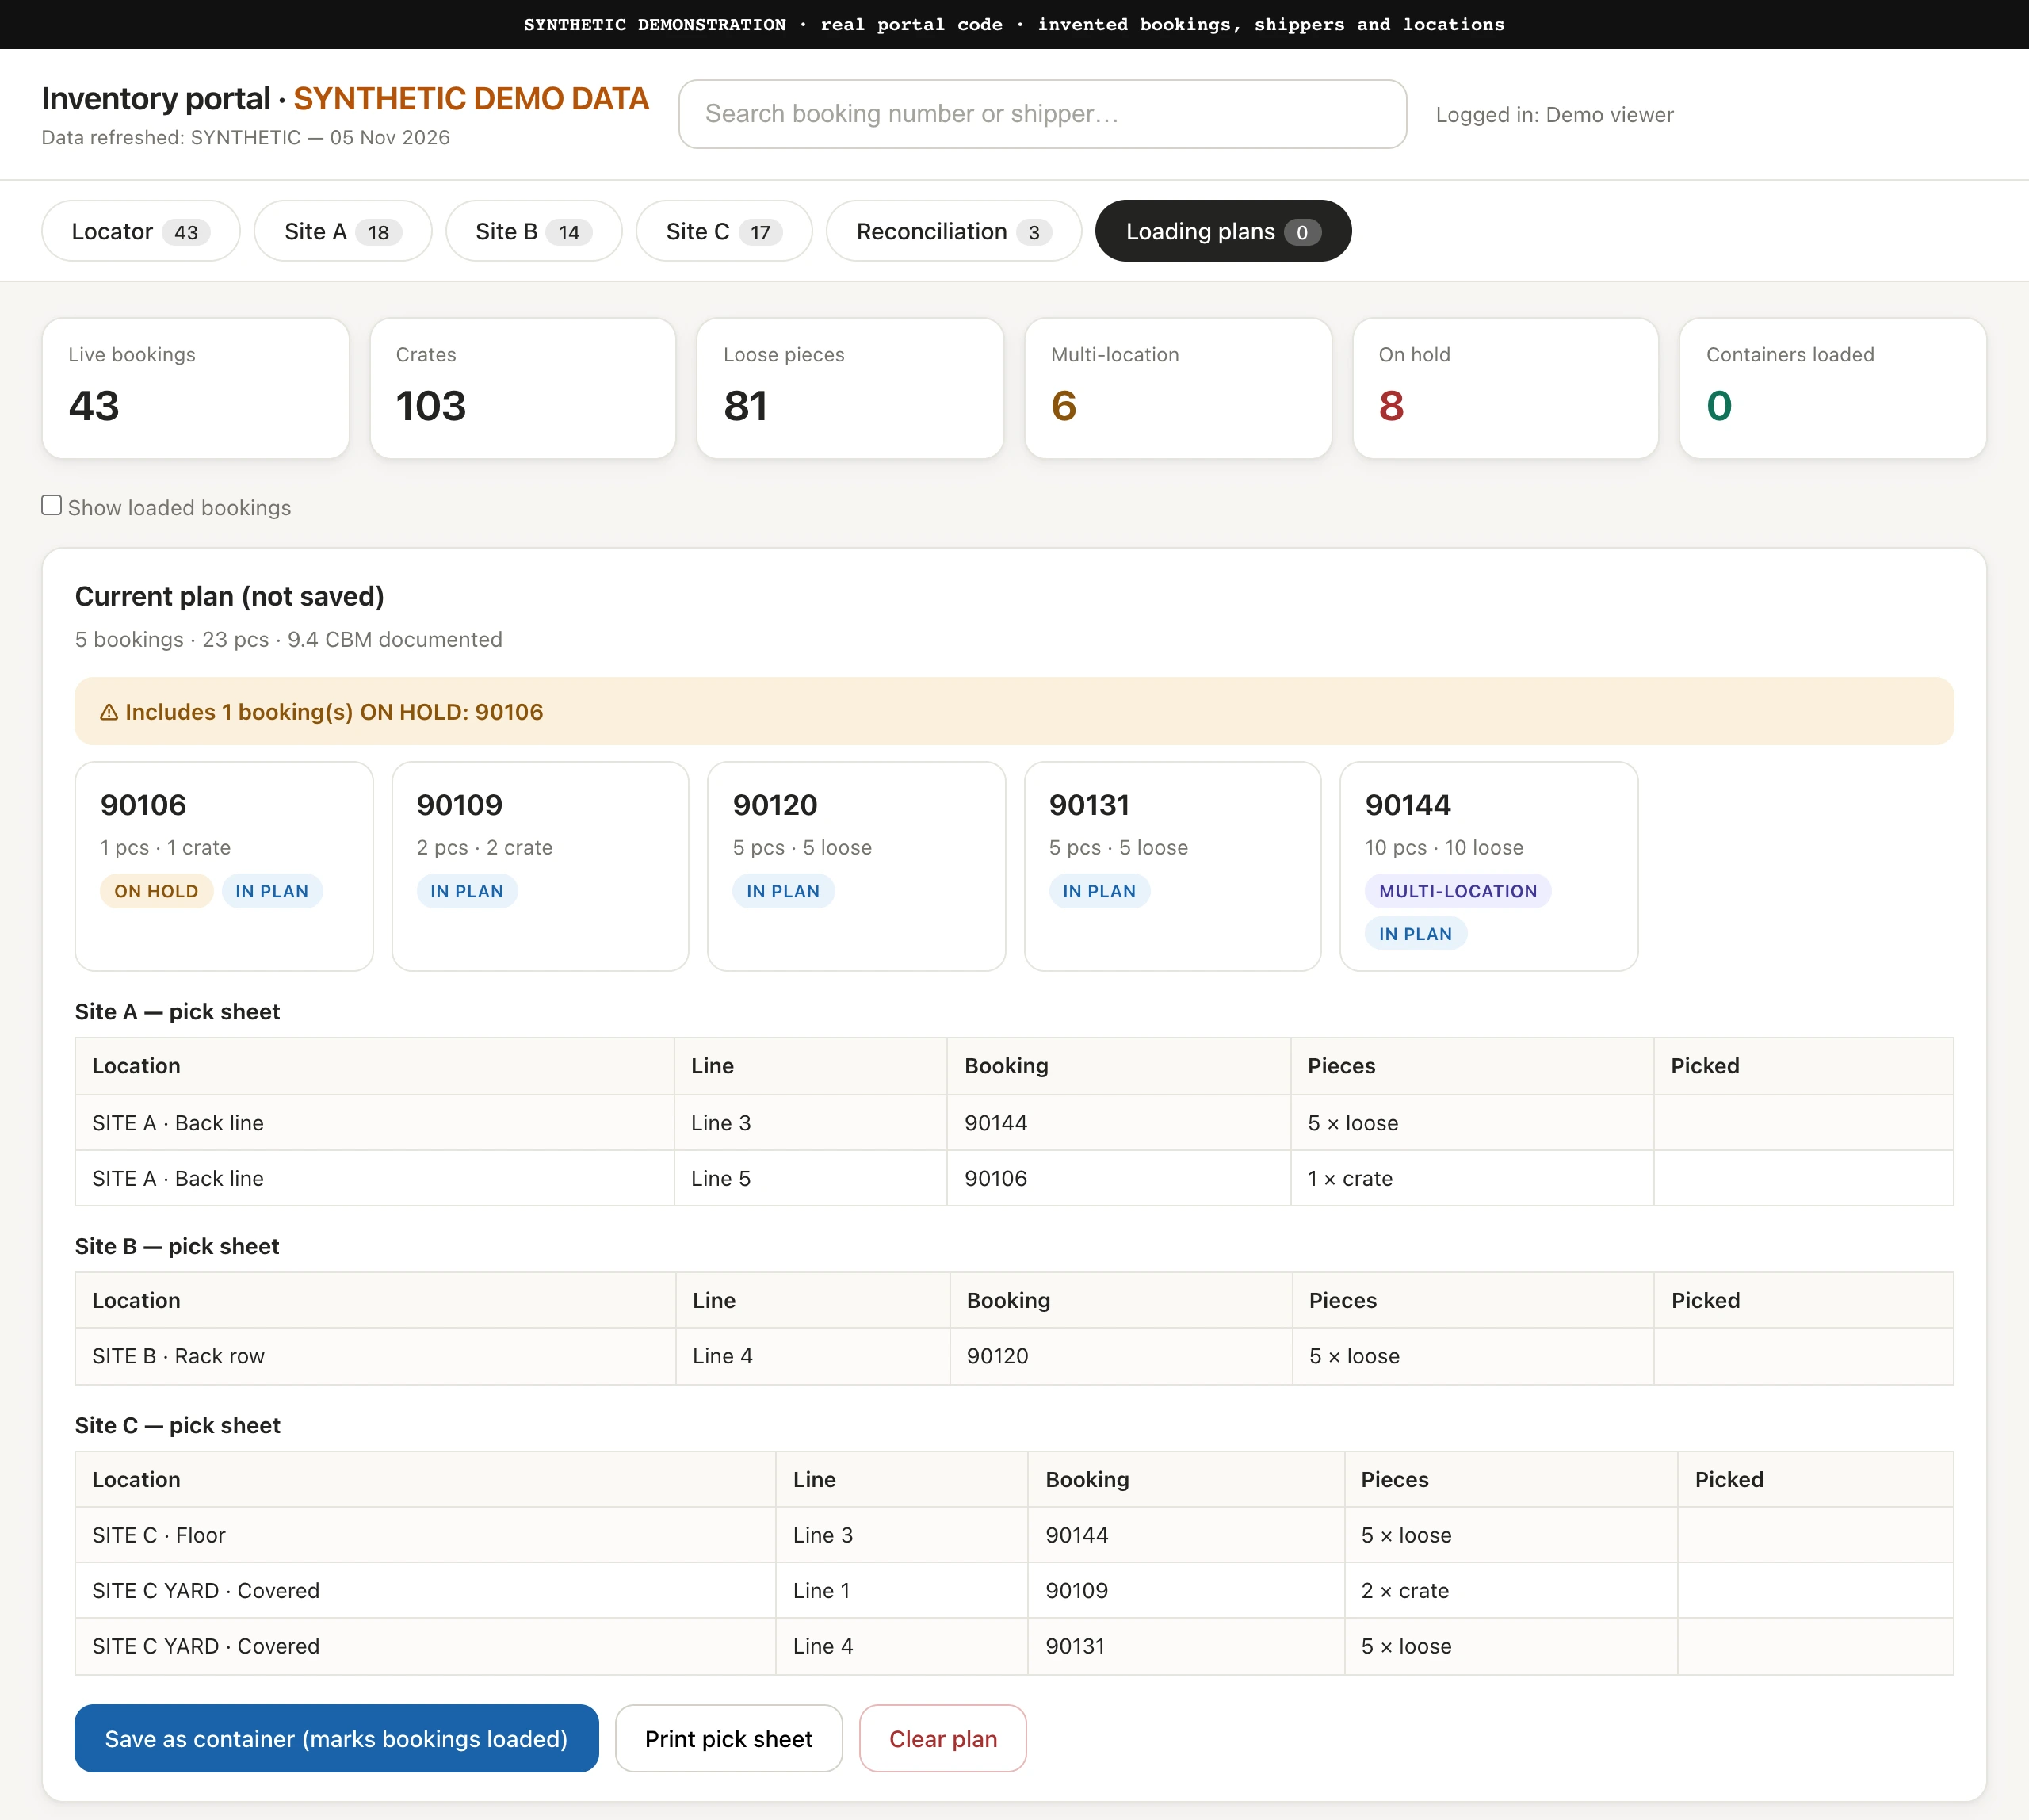
Where is this shipment? A portal for finding cargo across warehouses, checking mismatches and planning loads. I designed it and built it with AI assistance. Colleagues used it for real work.
Requirements, matching rules and AI-assisted implementation
Demonstration with fictional bookings. The locator shows where each booking’s pieces are stored and flags holds and bookings split across sites.Demonstration with fictional bookings. The tool prepares a pick sheet for each warehouse and flags bookings on hold.
Part three. The next step
Give interest somewhere to go.
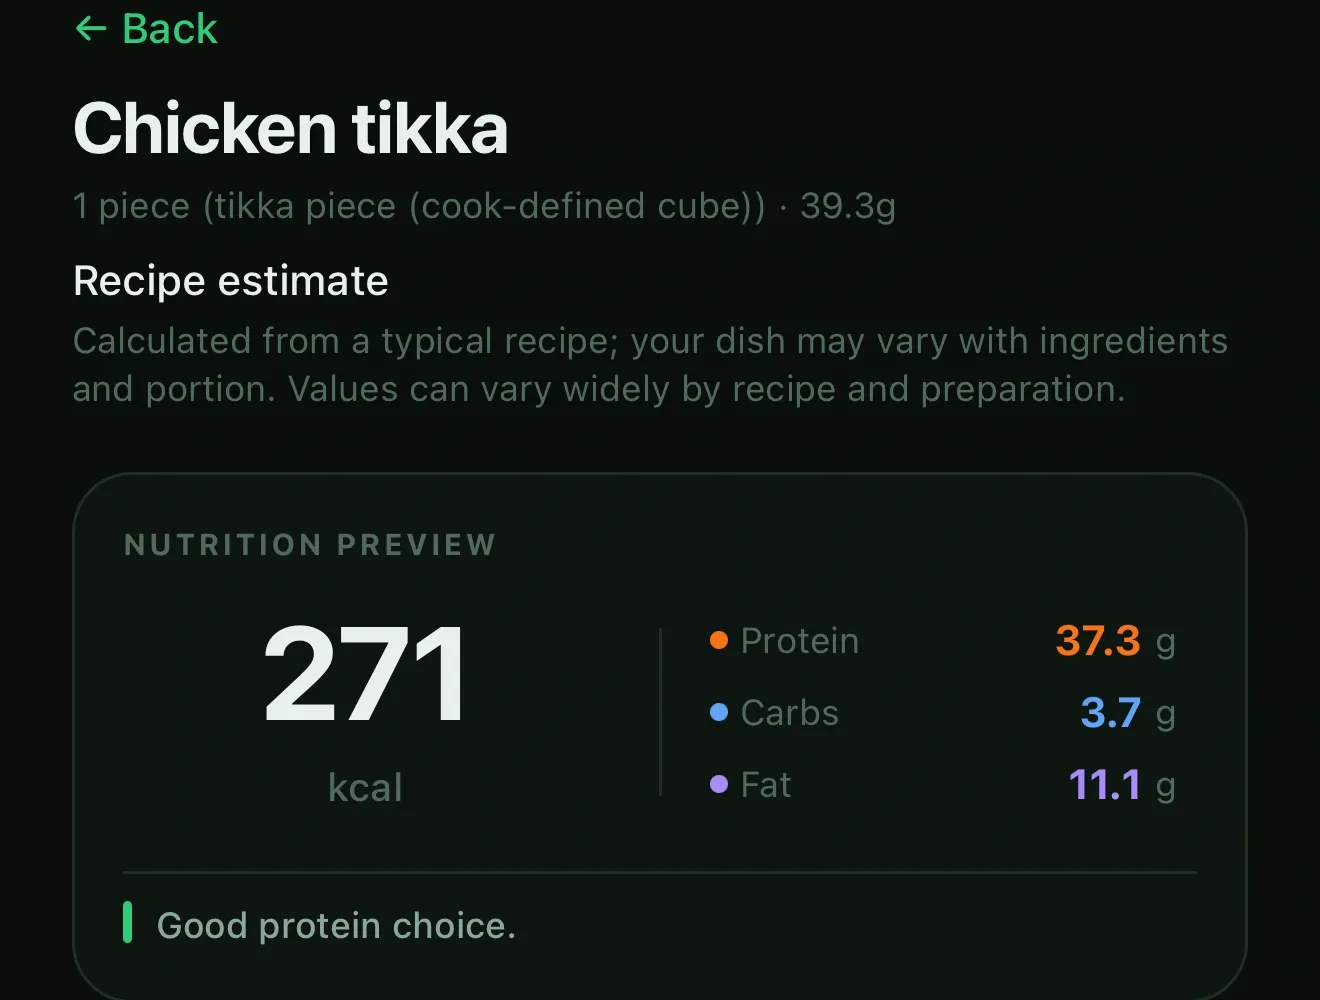
Two websites and a nutrition app, each directed from the first idea to a working result.
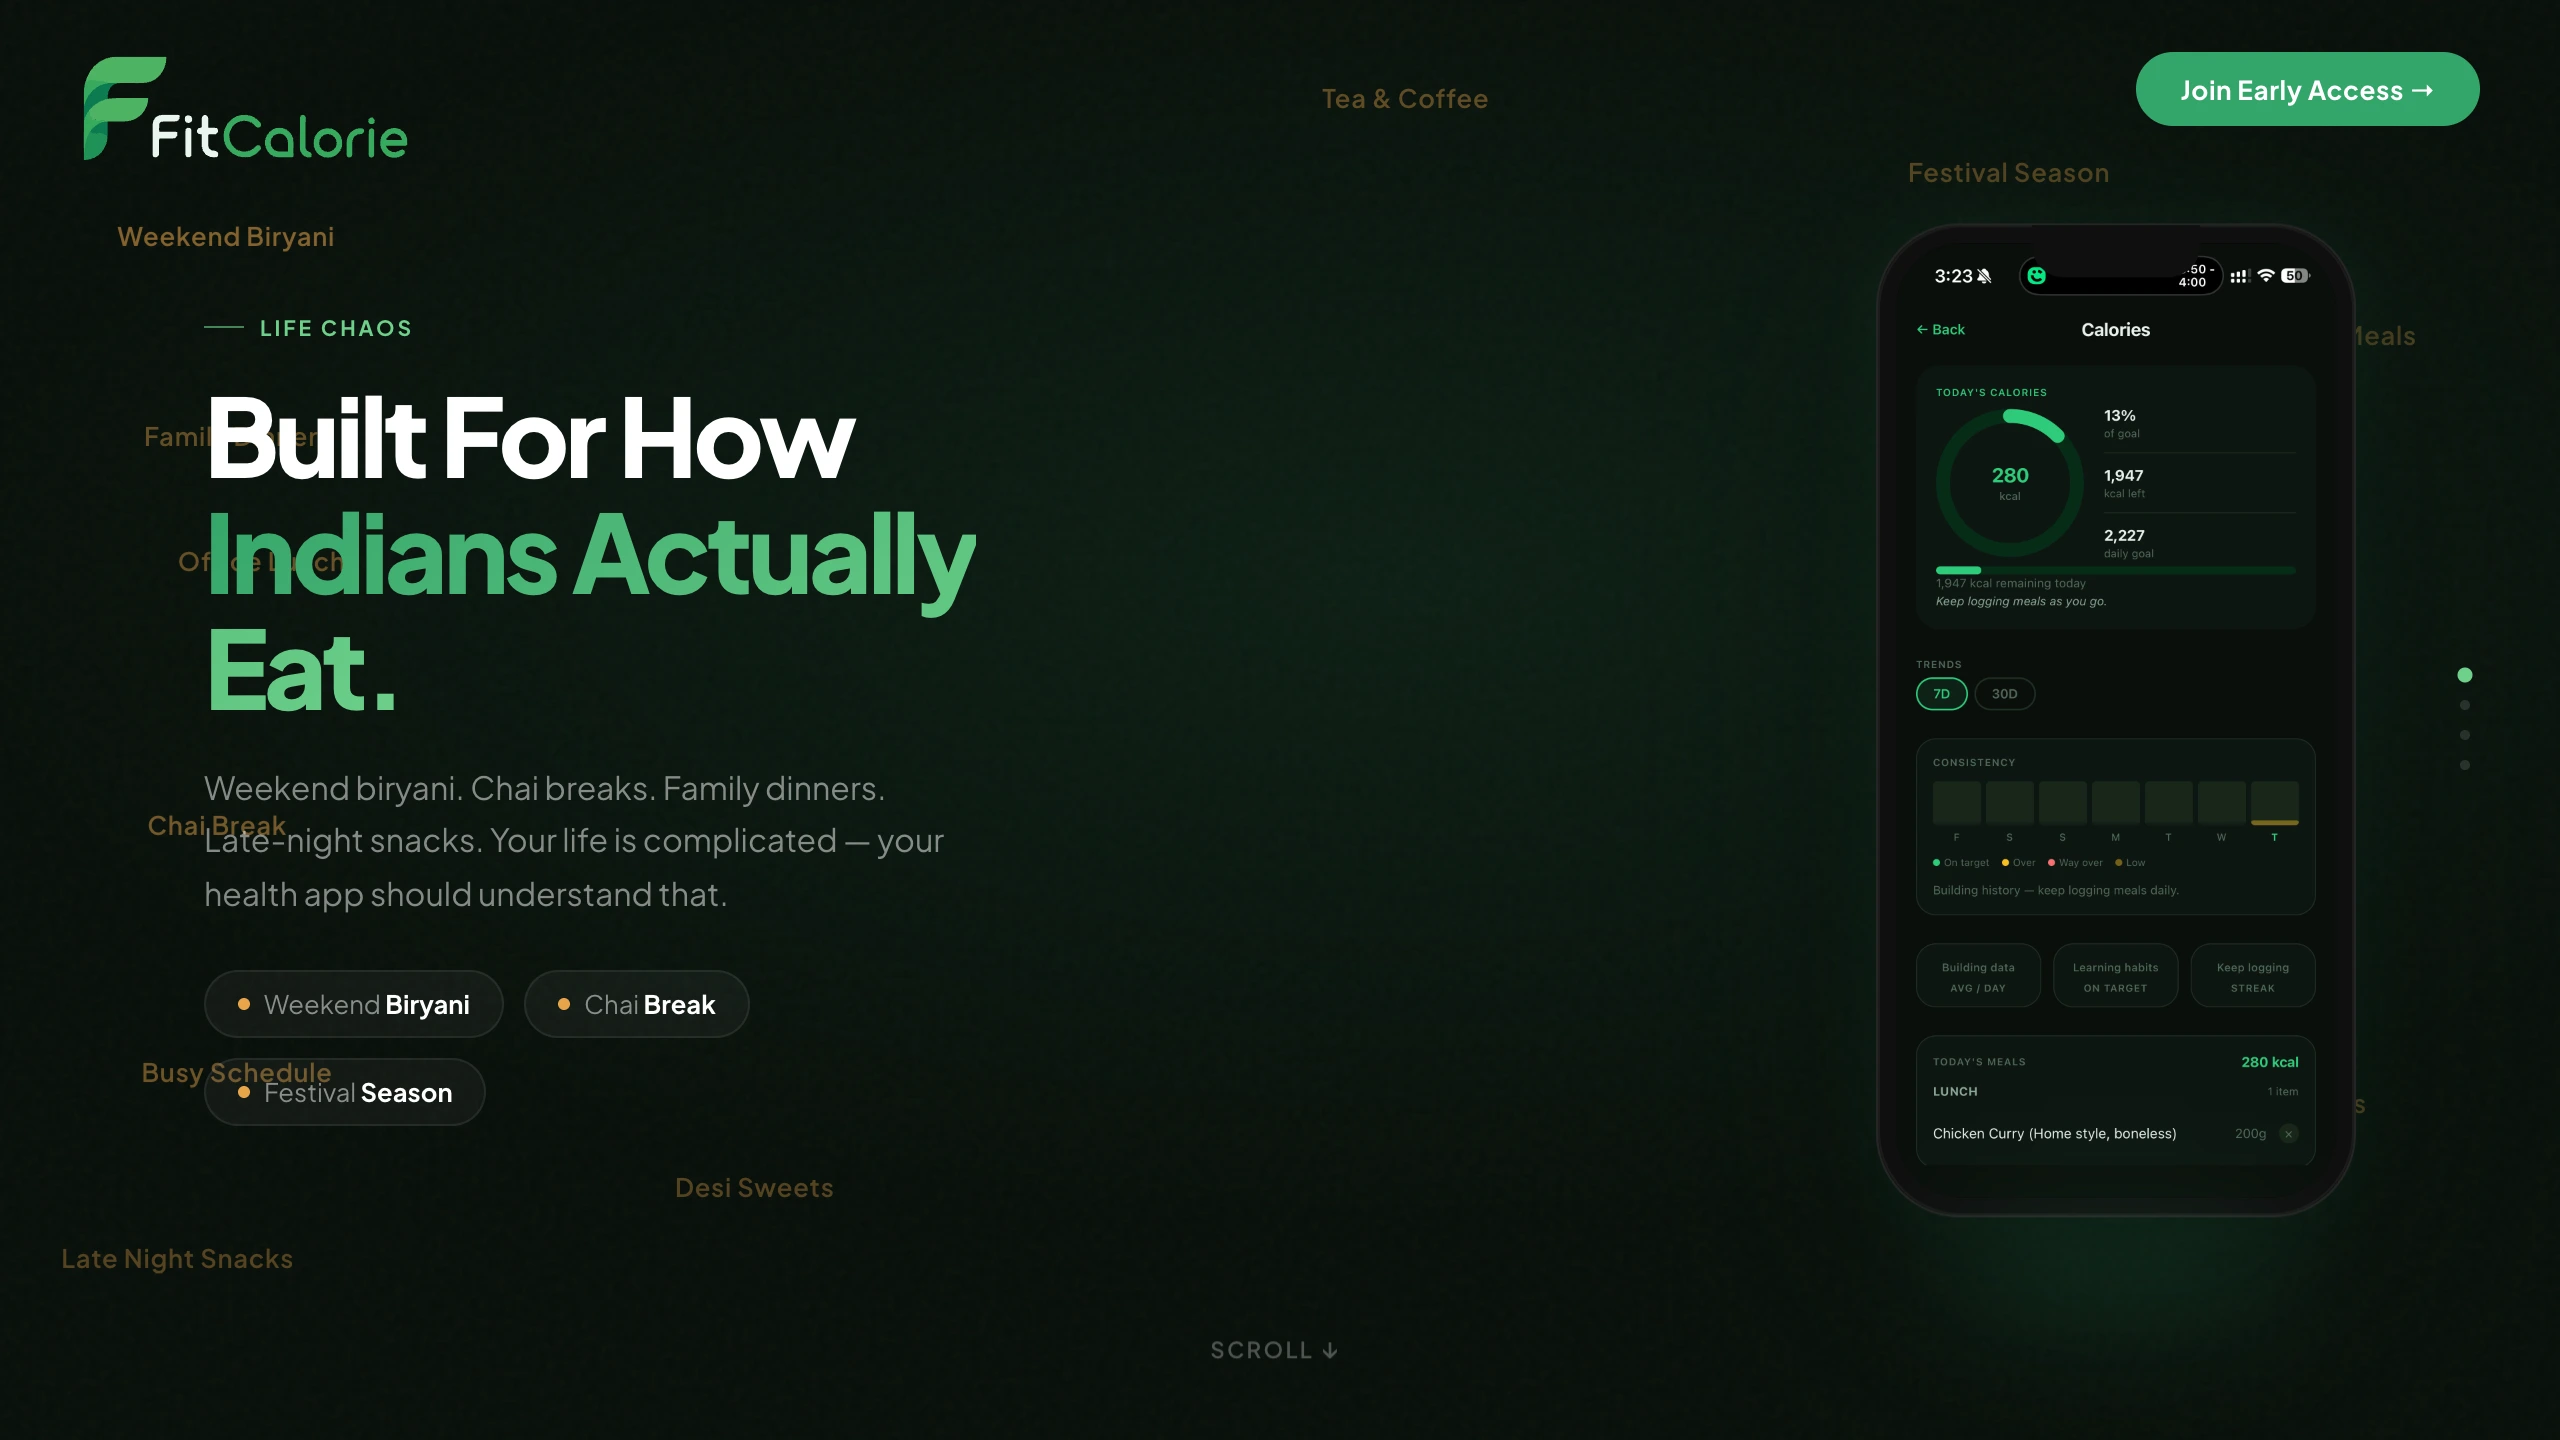
10FitCalorie landing page
Start with something familiar.
A launch page that starts with food people already know, and gives them a clear route to early access.
Positioning, page narrative and early-access journey
The Chroma Creative website as it stood on 11 November 2026. Shown as project evidence.
How I work
If the tool doesn’t exist, I build it.
AI and automation do the building. The rules, and the final word, are mine. Three examples, each with its record.
Automation
Leads file themselves.
A lead from a Meta form, the website or a chatbot lands in a shared sheet within seconds. Nobody copies it across.
Automation design and setup, in Latenode
Redrawn from platform screenshots · 11 November 2026 · Runs estimated from a month of usage, at one credit a run
automations live
5
months running
16
runs in the last month
~120
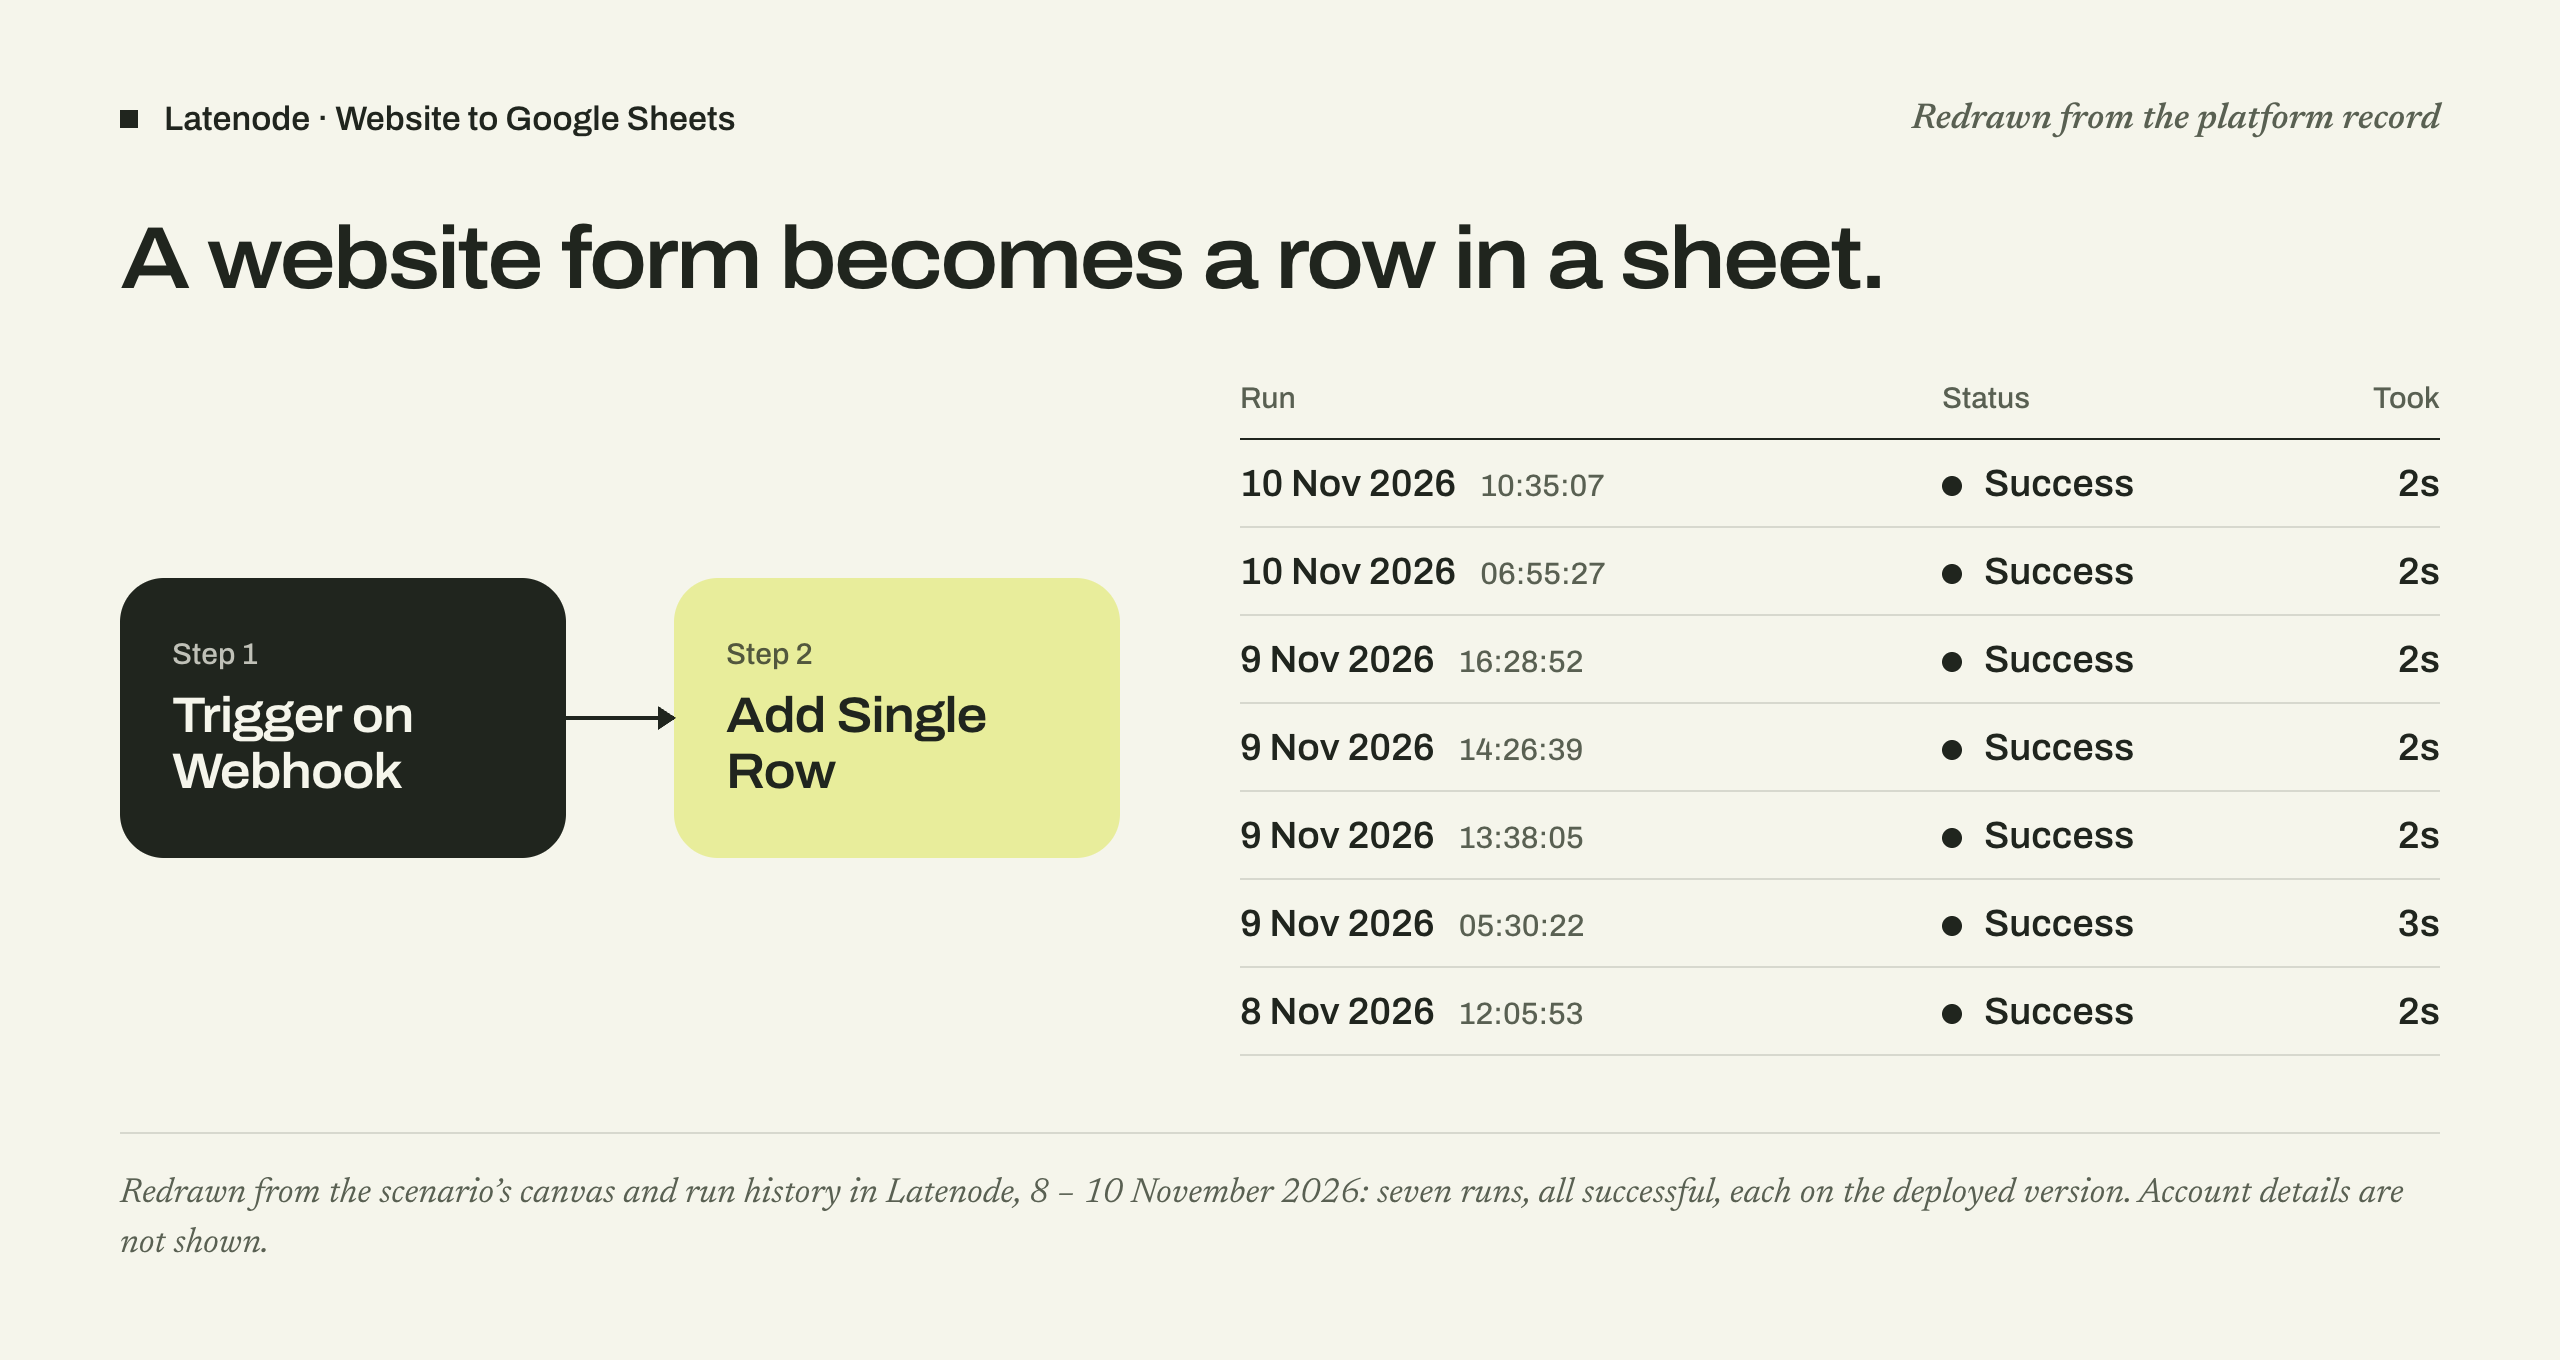
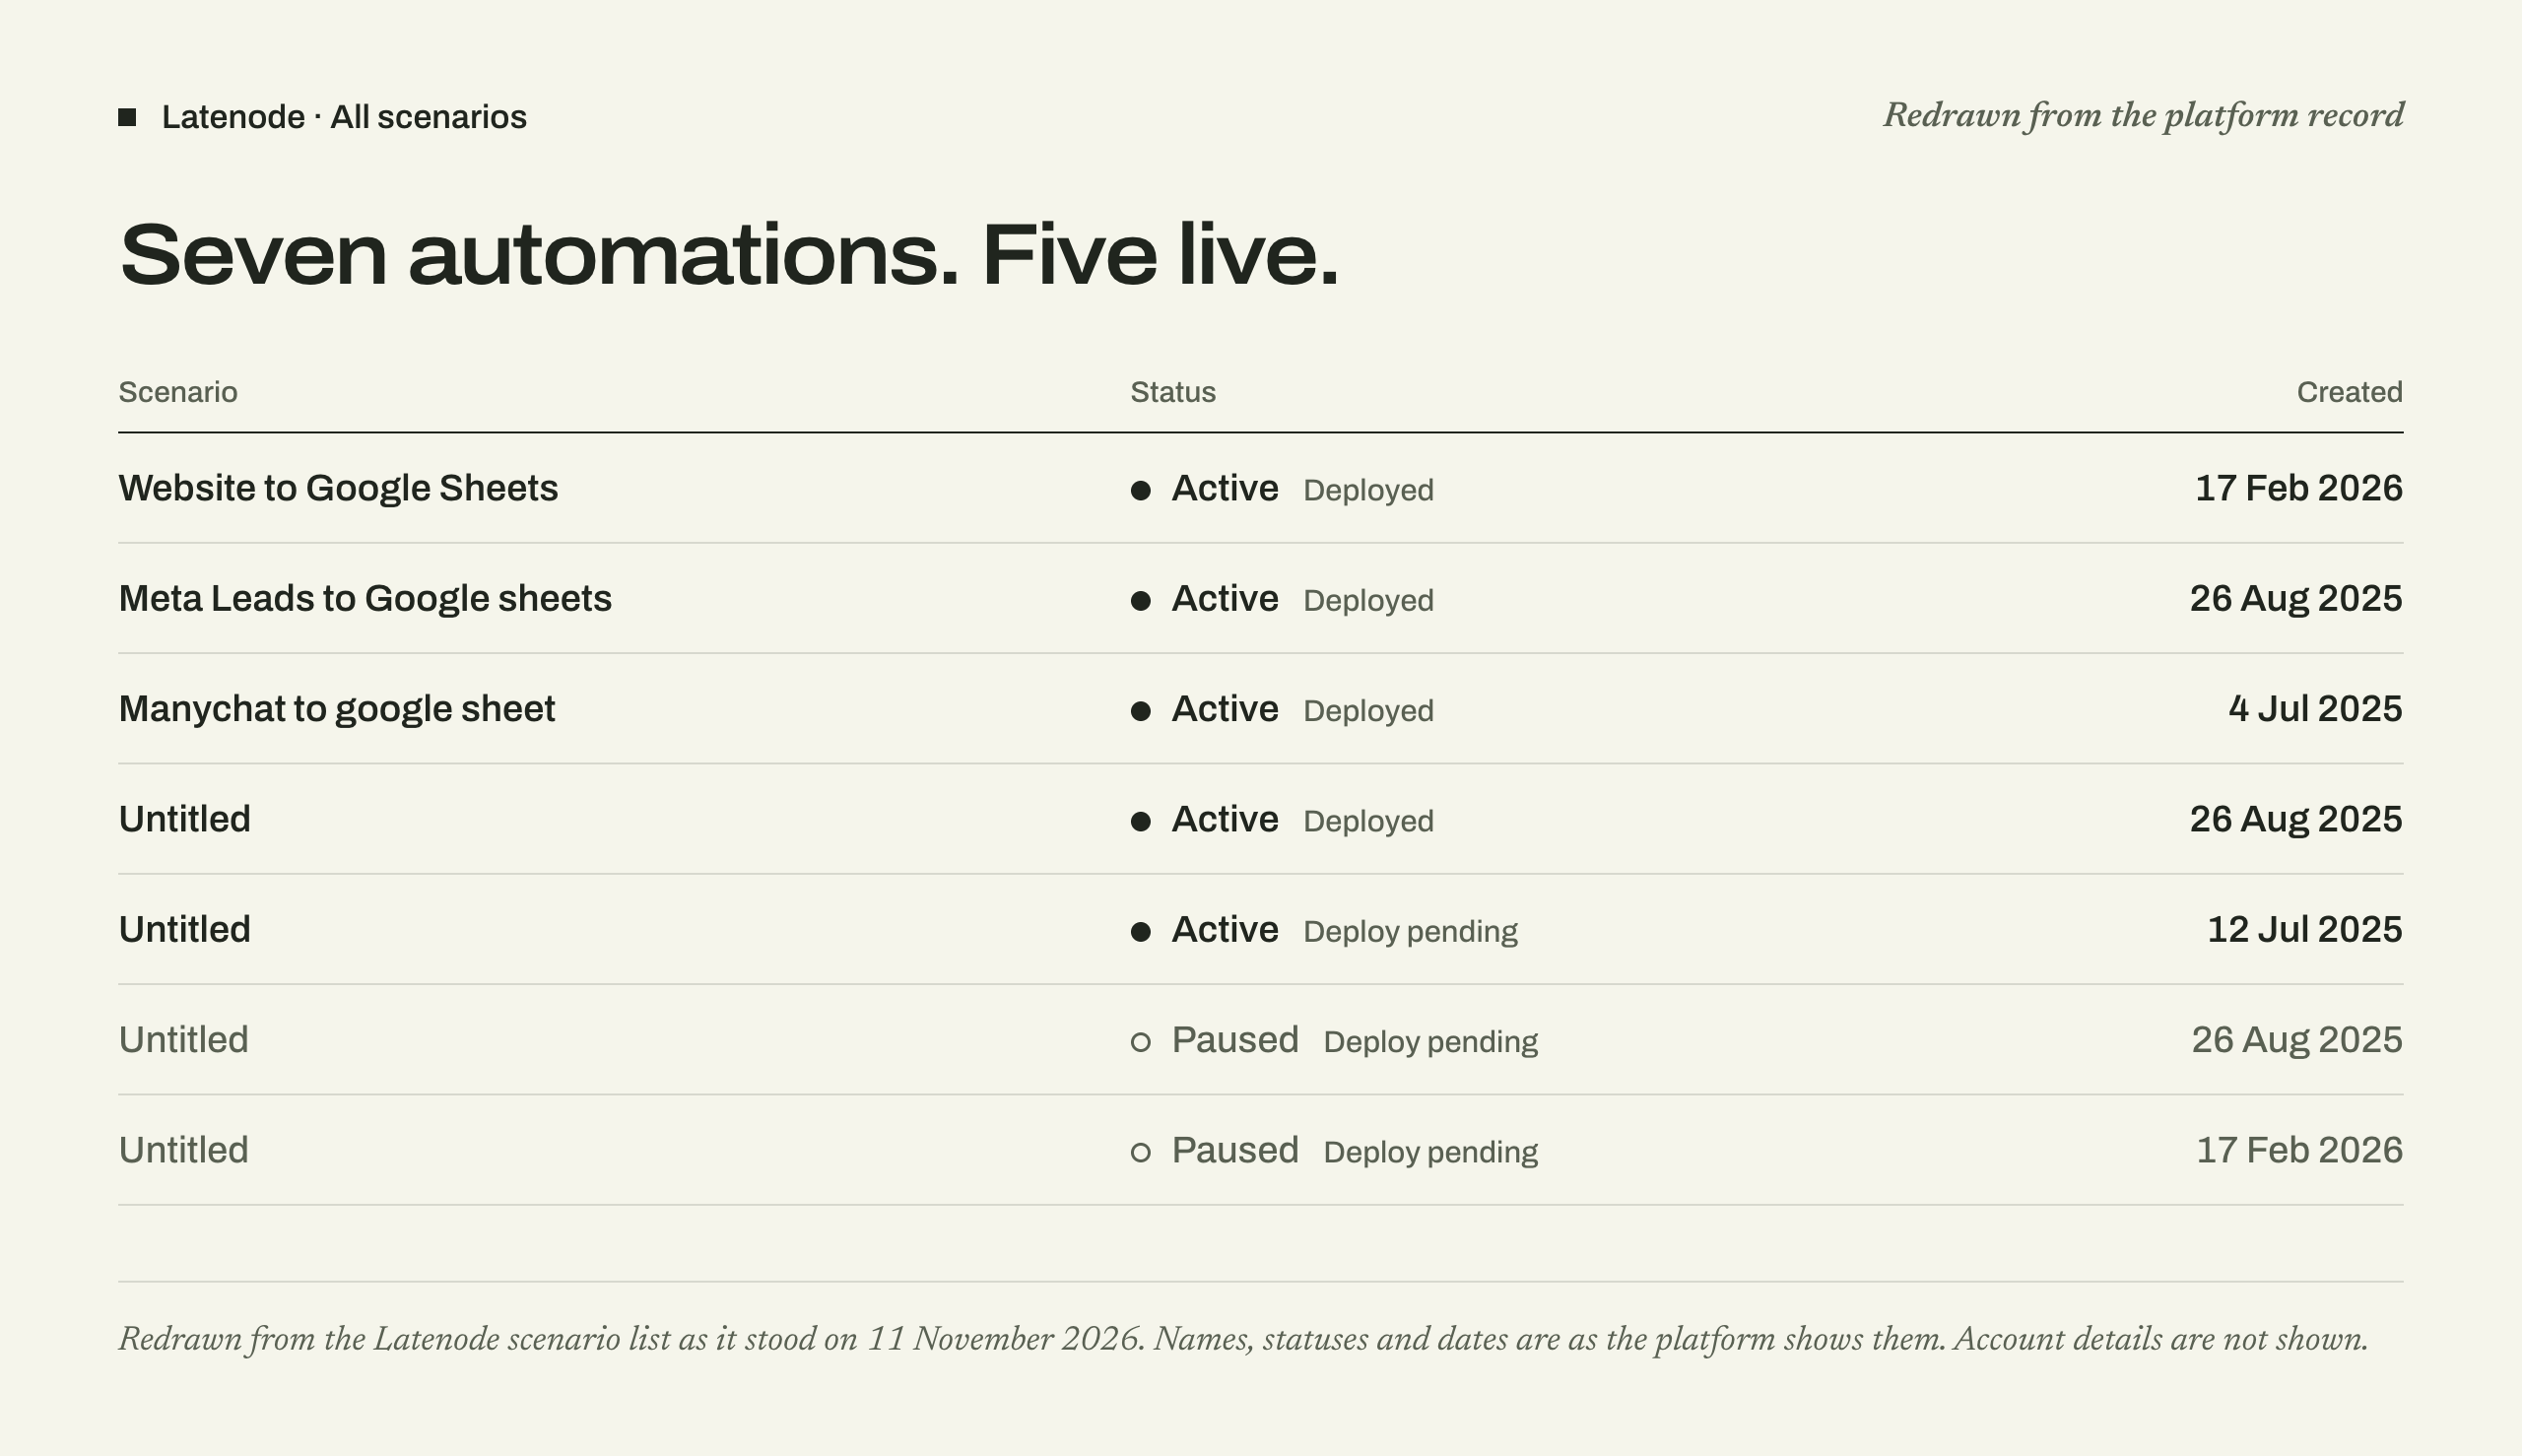
Redrawn from Latenode, “Website to Google Sheets”: a website form submission becomes a row in a sheet. Seven runs on 8–10 November 2026, all successful, each in two or three seconds. See the platform screenshotRedrawn from the Latenode scenario list, 11 November 2026: seven scenarios, five active, the oldest from July 2025. See the platform screenshot
AI-assisted building
Three tools. No development team.
A CRM report, a warehouse portal and a nutrition app. I wrote the rules and tested every result; AI did the building. This website was made the same way.
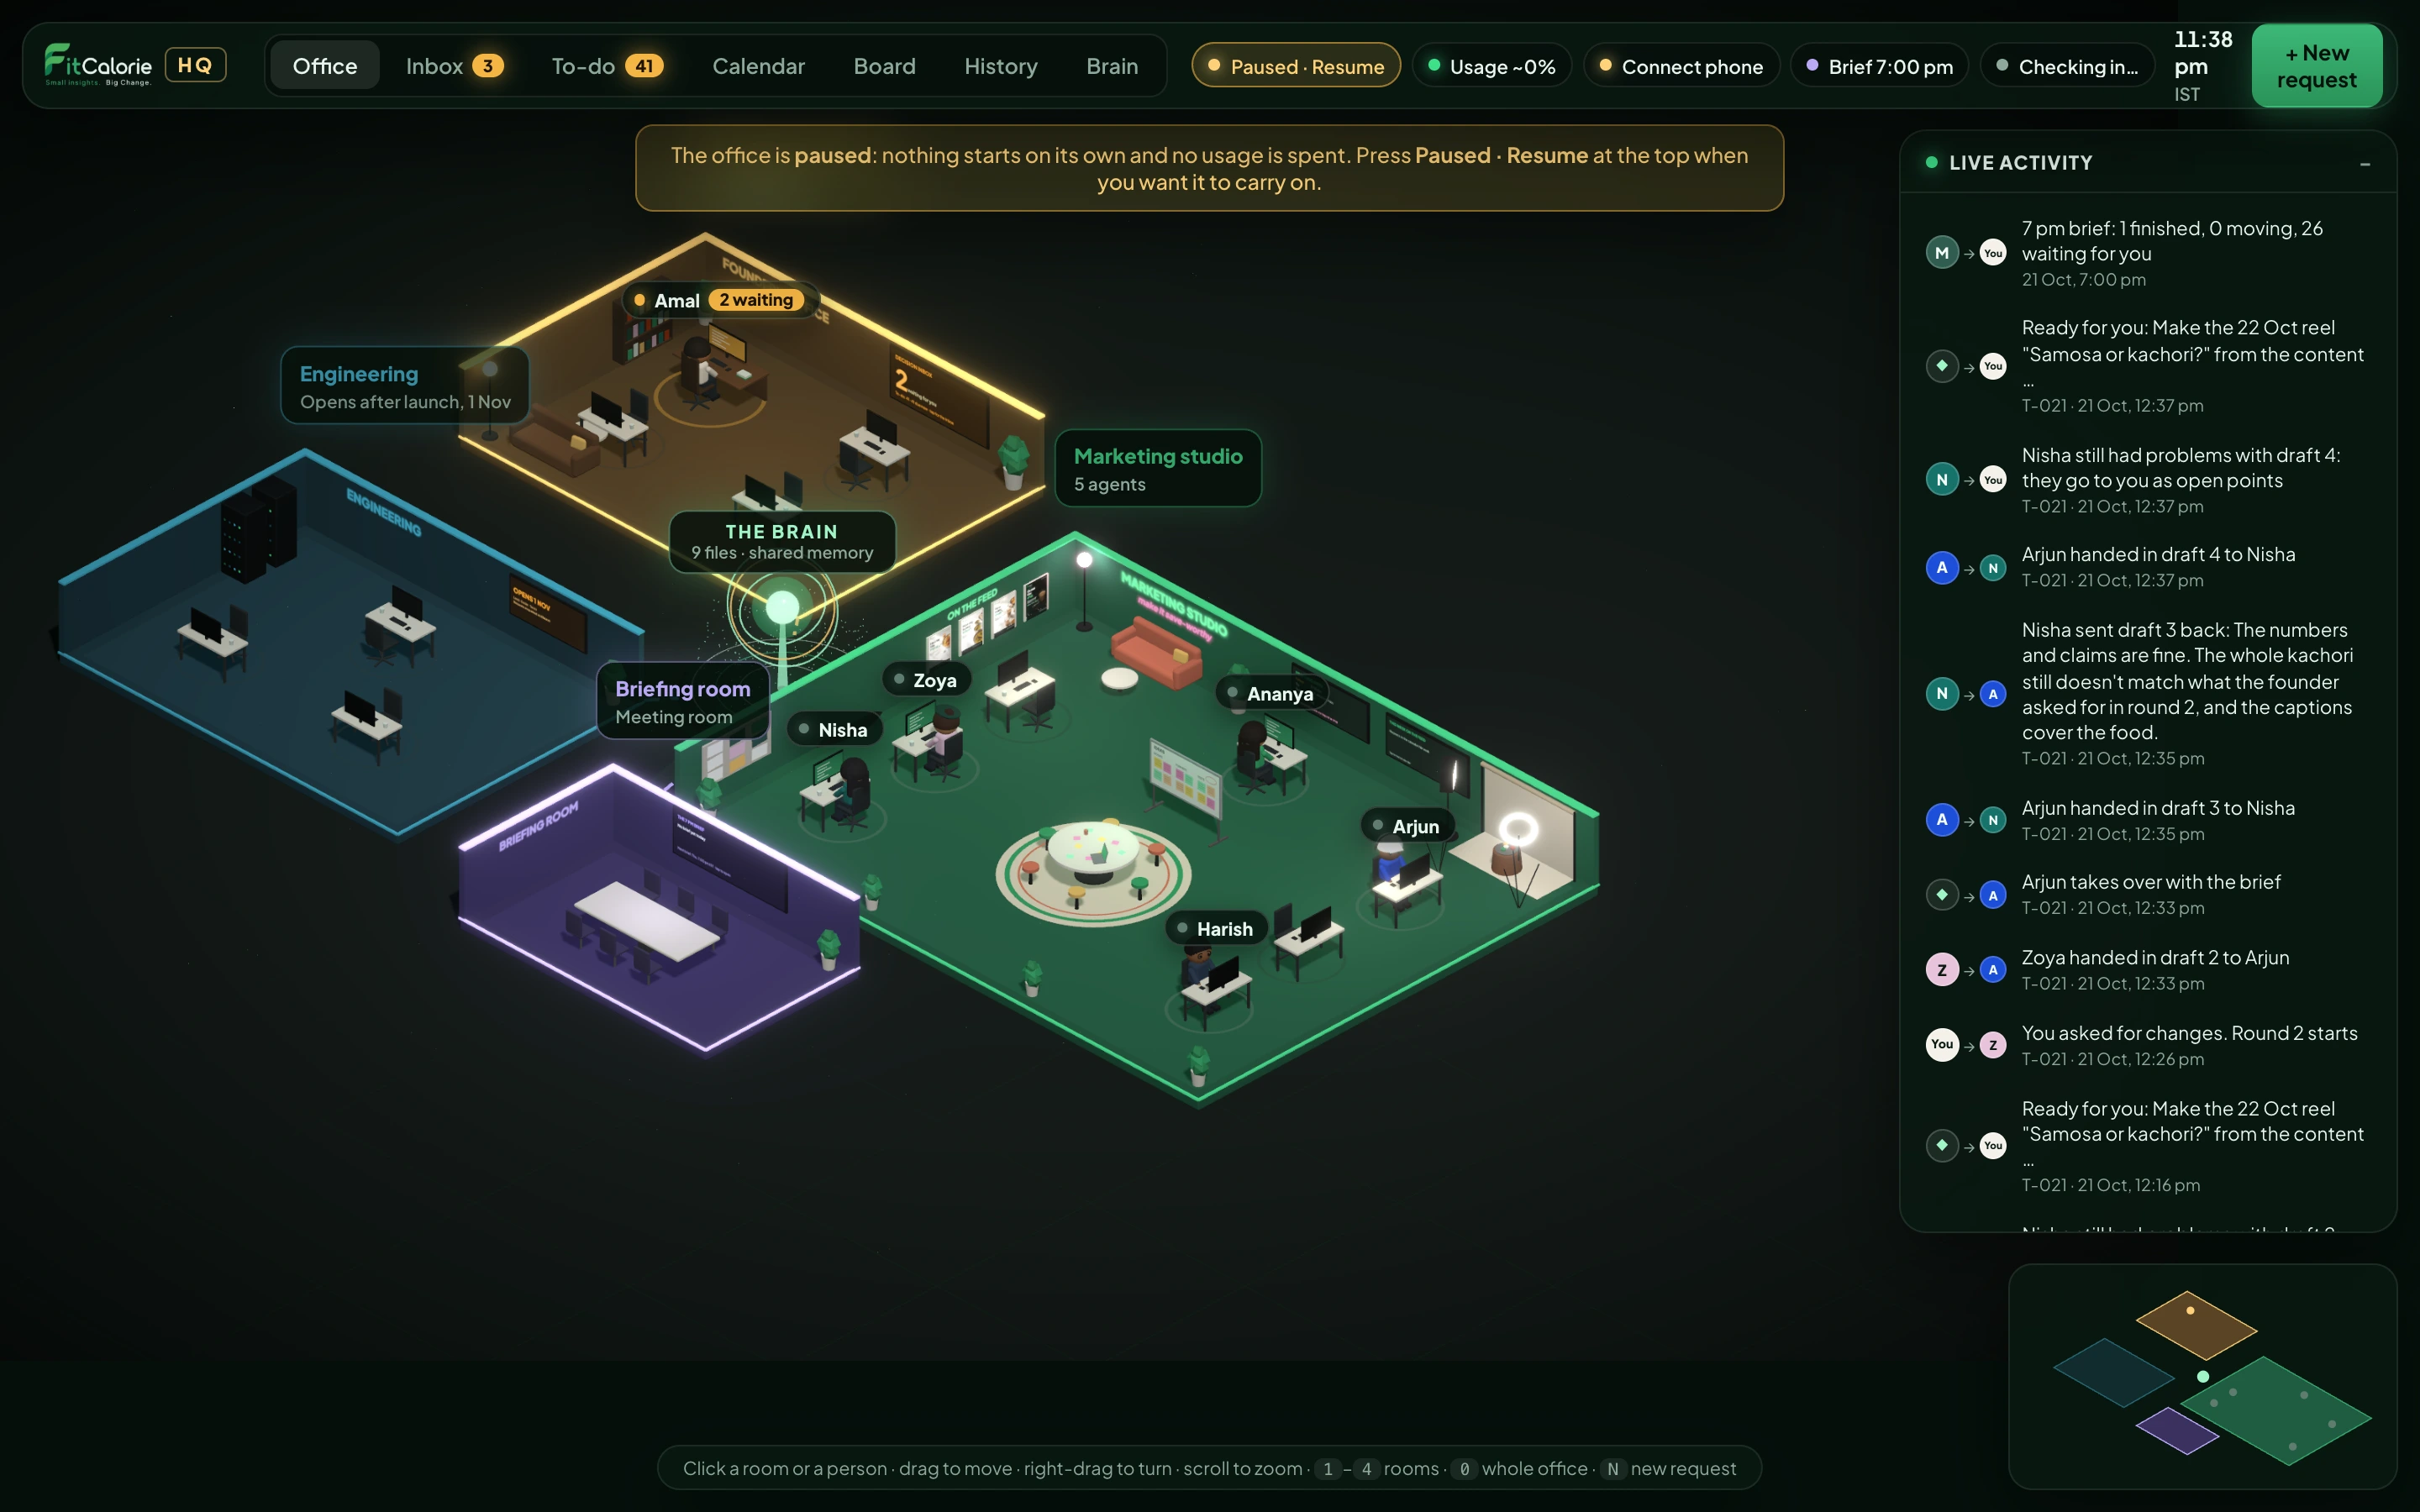
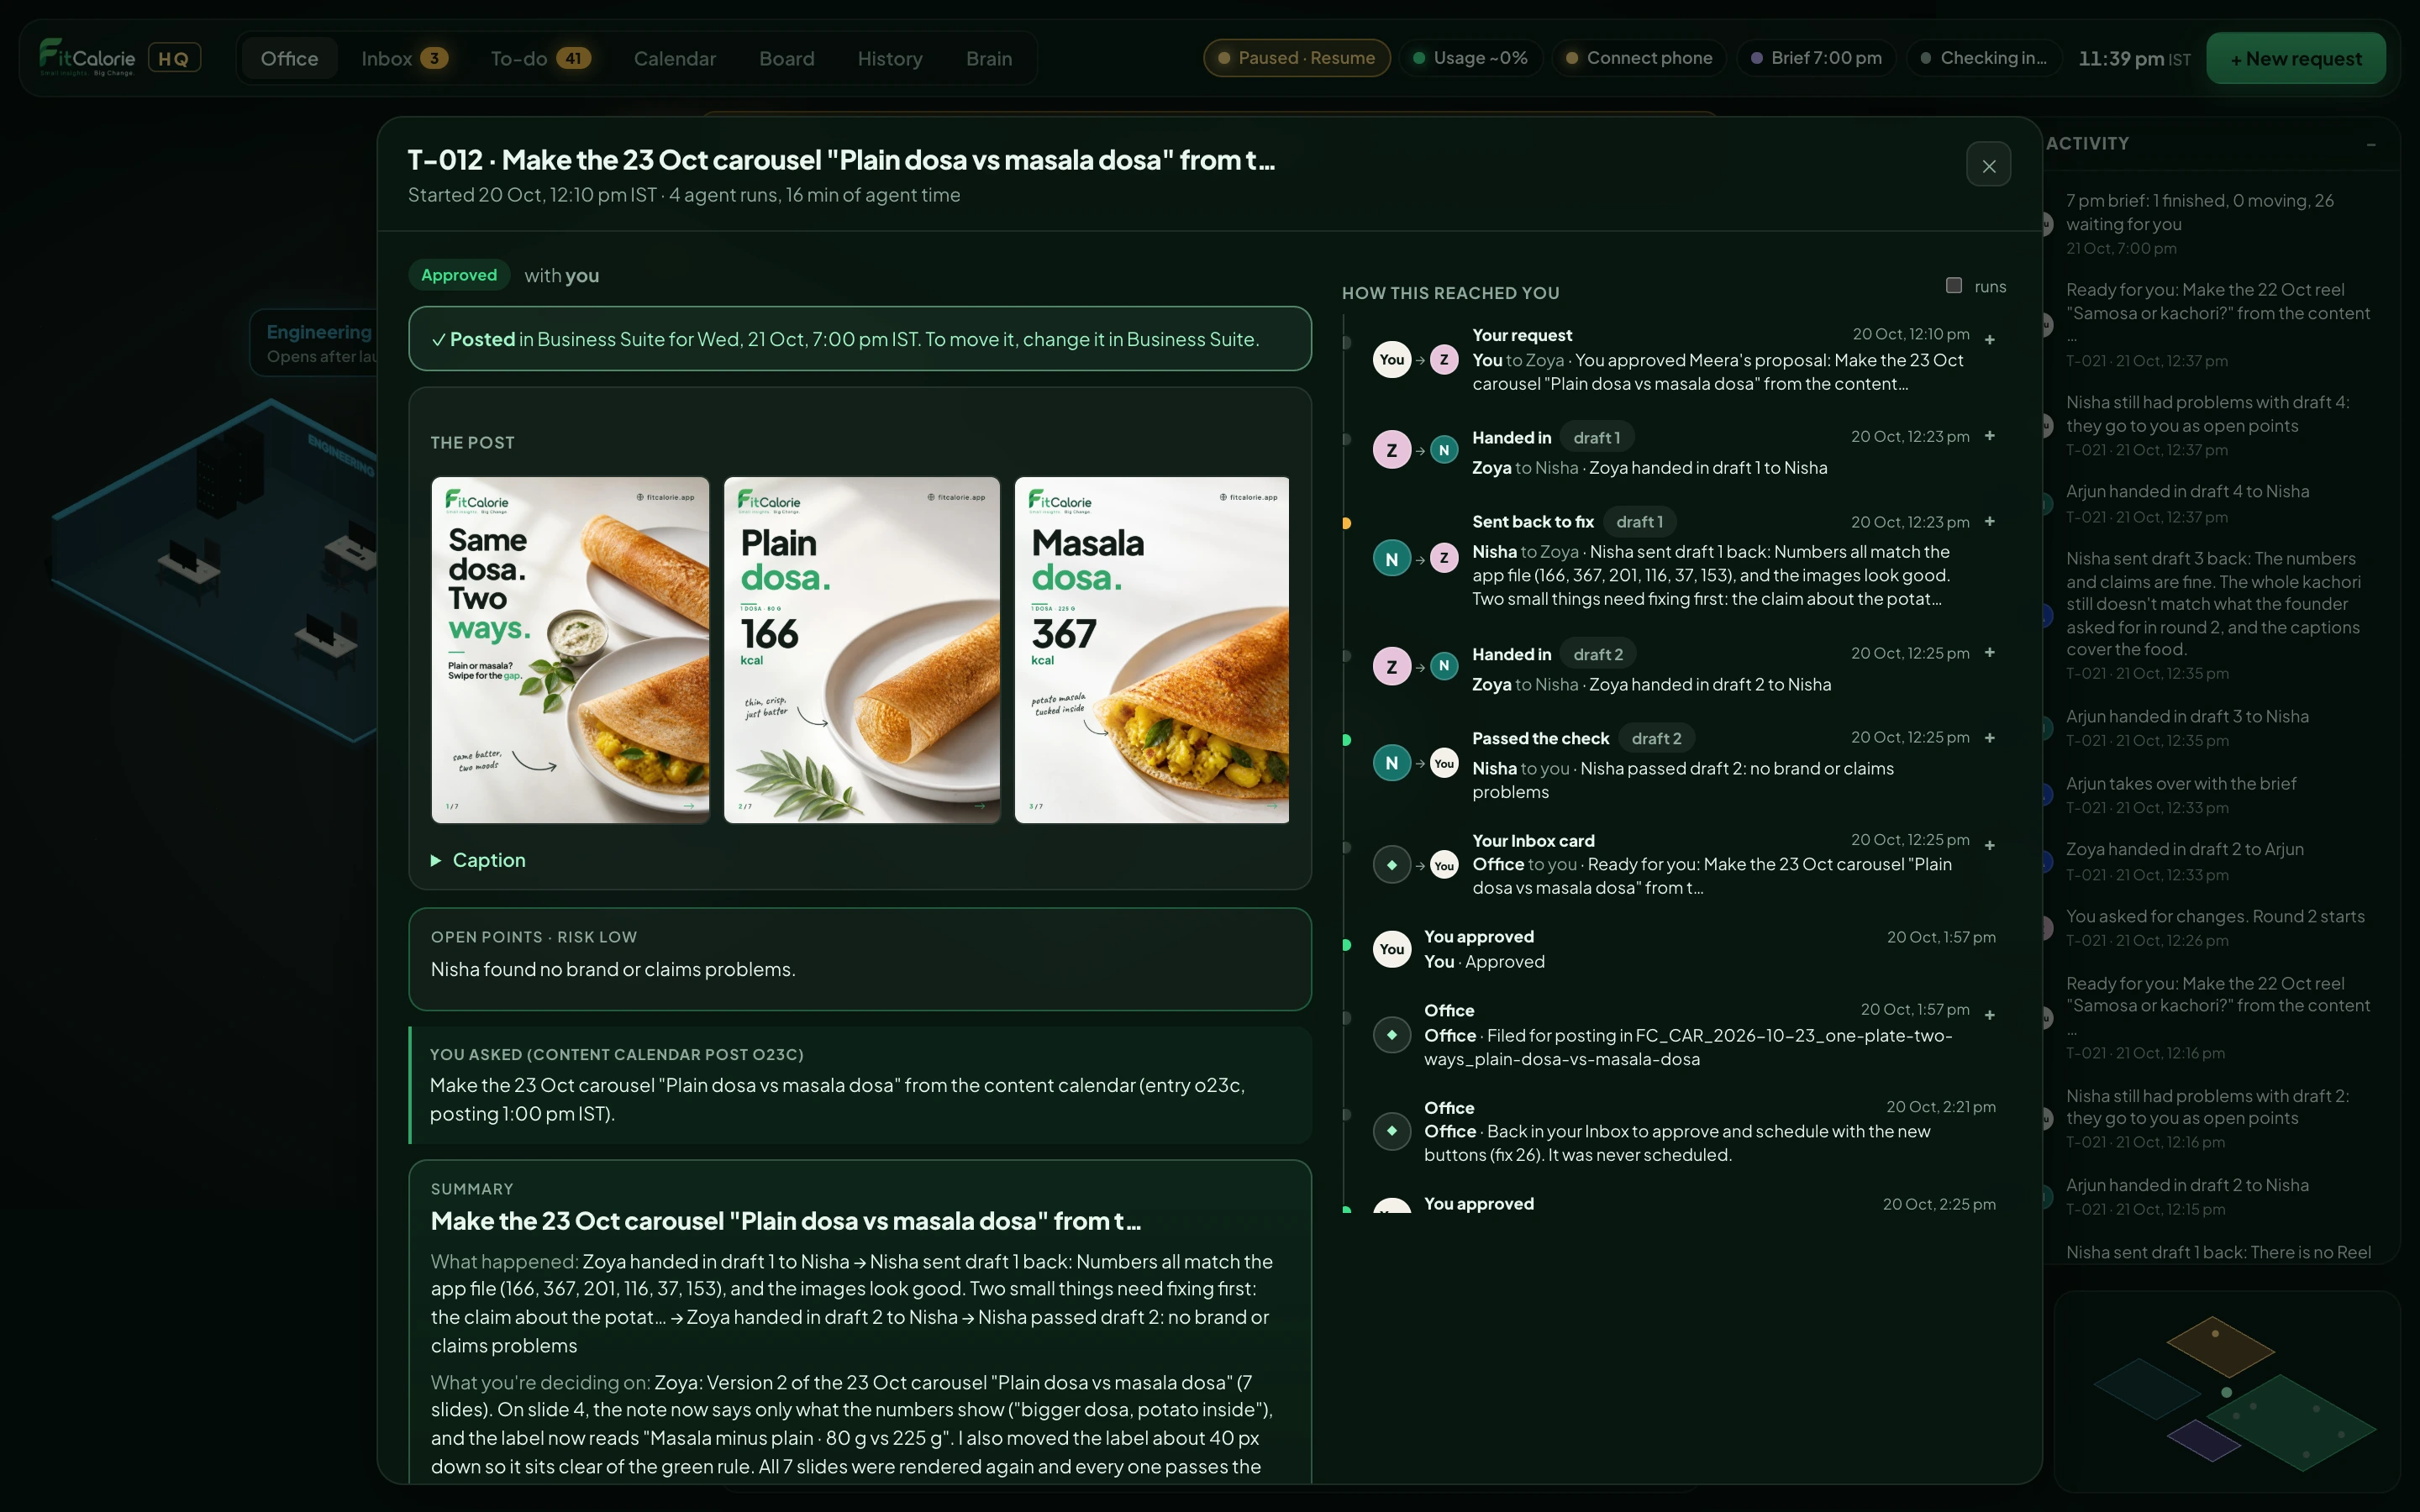
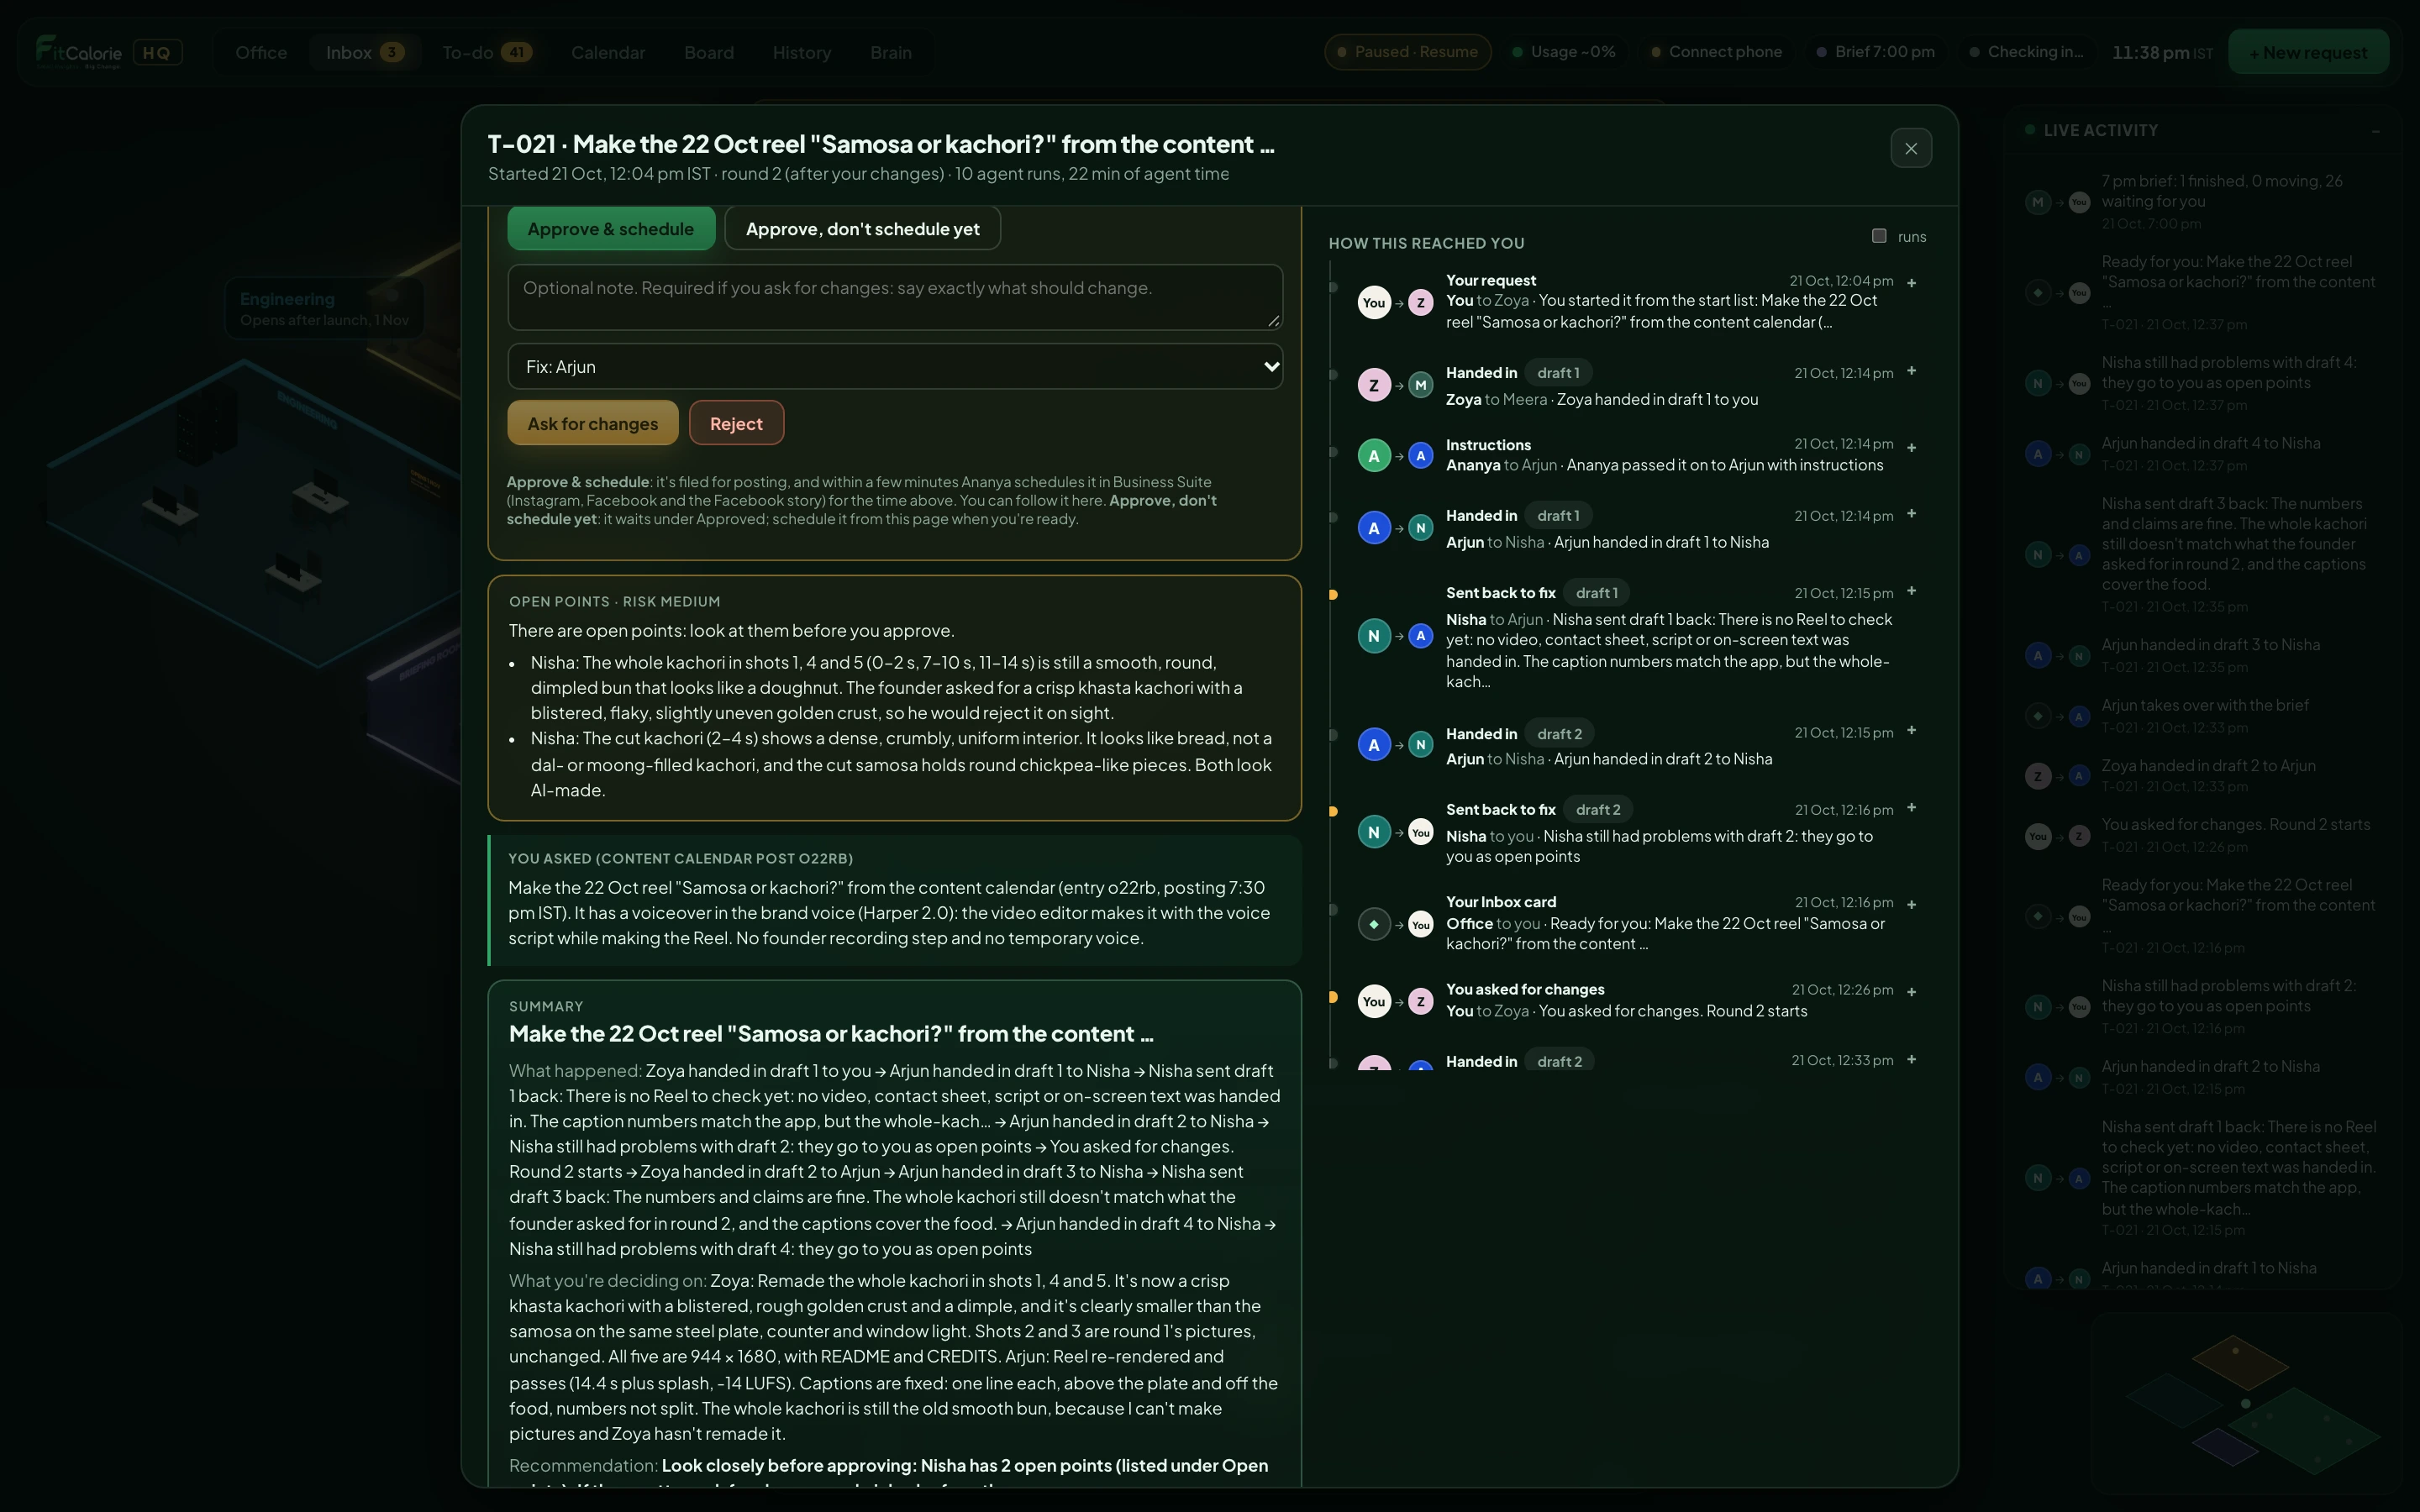
AI agents work on FitCalorie’s marketing, each with one job and written rules. A checker reviews every post before I see it, and nothing goes out without my approval.
Roles, rules, skills and every approval
From the office’s own records · 13–21 October 2026 · Screens from a paused copy
agent runs, every one logged
161
drafts the checker sent back
28
tasks in nine days
21
The office, paused. The founder’s room, the marketing studio with its agents, the shared memory they all read, and a live feed of every hand-off. Captured 11 November 2026 from a paused copy of the office records.One post and how it reached me: the designer’s draft, the checker’s send-back and pass, then my approval and scheduling. Usage cost hidden.A decision waiting for me. The checker’s open points come first; then I approve, ask for changes or reject. Of 21 tasks I approved 8 and rejected 11. Usage cost hidden.